Tuesday, July 26, 2011

Just did a comparison between the growth of Texas State Employment and Federal Employment during the Recession. What is my conclusion? We have a President named Rick Obama and a Governor named Barack Perry...

I used US Census data to get these numbers. Click on the numbers to go to the specific Census page with the data.  At BOTH levels of government employment increased DURING the recession.  NOW I am confused as to who is the "Big Government Liberal"...

Texas 2009                   265,310  
Texas 2007                   259,578          

State Employees INCREASED  by 5,732  or +2.2%
The percentage of State Employees to the population of Texas is (265,310/24,782,302) = 1.07%

Federal  2009               2,823,777
Federal  2007               2,730,050

Federal Employees INCREASED by 93,727 or +3.4%
The percentage of Federal Employees to US population is (2,823,777/310,000,000) = .91%.

College and Cigarettes---What do they have in common? You smoke one (but DON'T!) and the other smokes you (well, at least your wallet)...

Well, they both burn though your money--one figuratively and one literally.  Since 1970 the cost of attending higher education has increased 1,000%, medical care approx 550%, housing approx 420% and the price level of ALL things measured in the Consumer Price Index (including the items already mentioned) approx 375%. Do you ever ask yourself WHY college, overtime, has increased in price much more relative to ANYTHING else in the economy? Opps, an exception below...
Source: Carpe Diem

Cigarettes and tobacco products have increased more. We know that is because taxes have increased on those products significantly. Higher education is not heavily tax, BUT it is heavily subsidized. It that the root of the problem? We all know how much we PAY for college, but I believe no one knows how much it actually COSTS. Those are two different concepts.

Nice graphic showing how much of your pay each day goes to paying taxes and how long you have to work to pay those taxes. You won't look at each minute of the working day the same after this...

Click on the image to make larger or go HERE to the site to see it...How much of your working day and your wage goes to pay for various government programs. Puts it in a perspective even I can understand---my time. 


Source: HERE via Chartporn


Another National Debt Interactive---I never tire of these..We MUST be informed on this issue...

Go HERE for a more clear image and interactivity...


Source: Congressional Quarterly

Treasury securities are the most sought-after in the world because the assumption that United States would always be able to repay its debts has generally gone unquestioned. That is why officials are negotiating to increase the government’s borrowing limit and avoid a default.
More than $9 trillion of the total debt is held by “the public” — a broad category that includes individual investors in the United States and overseas, the Federal Reserve system, and foreign governments and central banks. The remaining debt is held by government accounts, mostly trust funds established to collect dedicated revenue to pay for such programs as Social Security, Medicare and highway construction.
Almost all of the debt held by the public is “marketable,” meaning that those securities are bought and sold in financial markets. The debt held by the Fed is part of those marketable holdings. So is the debt held by China, the largest foreign creditor at $1.1 trillion. Japan is a close second at $900 billion. Domestic investors — from mutual funds to institutions, such as pensions, to individuals — hold $3.2 trillion in marketable debt and a small share of the non-marketable debt, particularly savings bonds.

Notes

Countries listed under "foreign investors" indicate where Treasury securities are held. That does not mean that citizens, governments or central banks of that country own the securities. They may actually be owned by citizens or institutions from third countries that used the listed country for the purchase transaction.

Airlines are currently NOT collecting Federal Taxes on tickets you purchase. The price of your ticket should decrease by the amount of the tax, RIGHT? HA! Let me 'splain' to you what is happening---My graphs included for no charge---or tax.

Because Congress did not fully fund the Federal Aviation Administration (FAA) in a bill last week, the FAA is NOT collecting some taxes that are levied on your purchase of a plane ticket. WOW! I guess that means the ticket price SHOULD decrease, right? Not so fast:

U.S. airlines raise fares as taxes lapse

Many U.S. airlines have raised fares in recent days to take advantage of a lapse in U.S. ticket tax collection after Congress failed last week to fully fund the Federal Aviation Administration budget, but passengers are not likely to notice any price difference.


The expiration of the FAA reauthorization on Friday means some aviation taxes are no longer being collected. These include a 7.5 percent sales tax on U.S. air transportation and a 7.5 percent sales tax on the purchase of air miles, said fare watcher FareCompare.com. Additionally, taxes on jet fuel are also reduced.


"Friday evening we adjusted prices so the bottom line price of a ticket remains the same as it was before prior to the expiration of federal excise taxes, etc.," American Airlines (AMR.N) spokesman Tim Smith said by email.

Let's look at this graphically. Assumptions: We look at one plane only with 200 seats. No matter what the price, there are only 200 seats REGARDLESS of what the price of the ticket is. Supply of tickets is Perfectly INELASTIC. The price of the ticket for the customer is $100 (see 1st graph) which includes the taxes levied BEFORE the latest event happened. 


Assume the taxes submitted to the govt totals $20 of the $100 final ticket price.  So, the price the airline actually receives for the flight is $80 ("Point B". This is illustrated in the graph below.

Without the $20 in taxes included in the ticket, the market price of the ticket SHOULD drop to $80 (Point "C"). Because the price of the ticket DECREASED ("ceterus paribus")  we move ALONG the existing demand curve, downward and to the right to Point "C". According to our market demand curve ("Demand*") at $80 the QUANTITY DEMANDED is 240 seats.  We can see that the QUANTITY SUPPLIED of seats is still 200. Our market is in dis-equilibrium where Quantity Demanded is GREATER than Quantity Supplied---we have a SHORTAGE of seats
It is clear that the market clearing price is $100 (Ceterus Paribus--assuming DEMAND does not increase or decrease).  The quantity demanded will decrease as the price increases to clear the market and ration the 200 seats.
Yes, theoretically 40 people will be rationed off the plane as we move back to the previous market equilibrium price of $100 and 200 seats:


The key difference is that the airline is the beneficiary of this lapse in policy. In the short term, they reap an additional $20 per ticket.  In economic terms, they are earning some "economic profits", profits over and above "normal profits"--Total Revenues - Total Costs (fixed costs + variable costs + opportunity costs).

We SHOULD expect competition to take care of these economic profits. The presence of economic profits sends a signal to the market that more seats are needed. An additional plane will be called into service and the SUPPLY of Airline Seats will INCREASE. The supply curve will shift to the right and the market price will decease to $80--the price of assumed "normal profits"...

Again, I made lots of simplifying assumptions, but overall this how the process works. I hope this helps you understand microeconomics a little better. :)

Monday, July 25, 2011

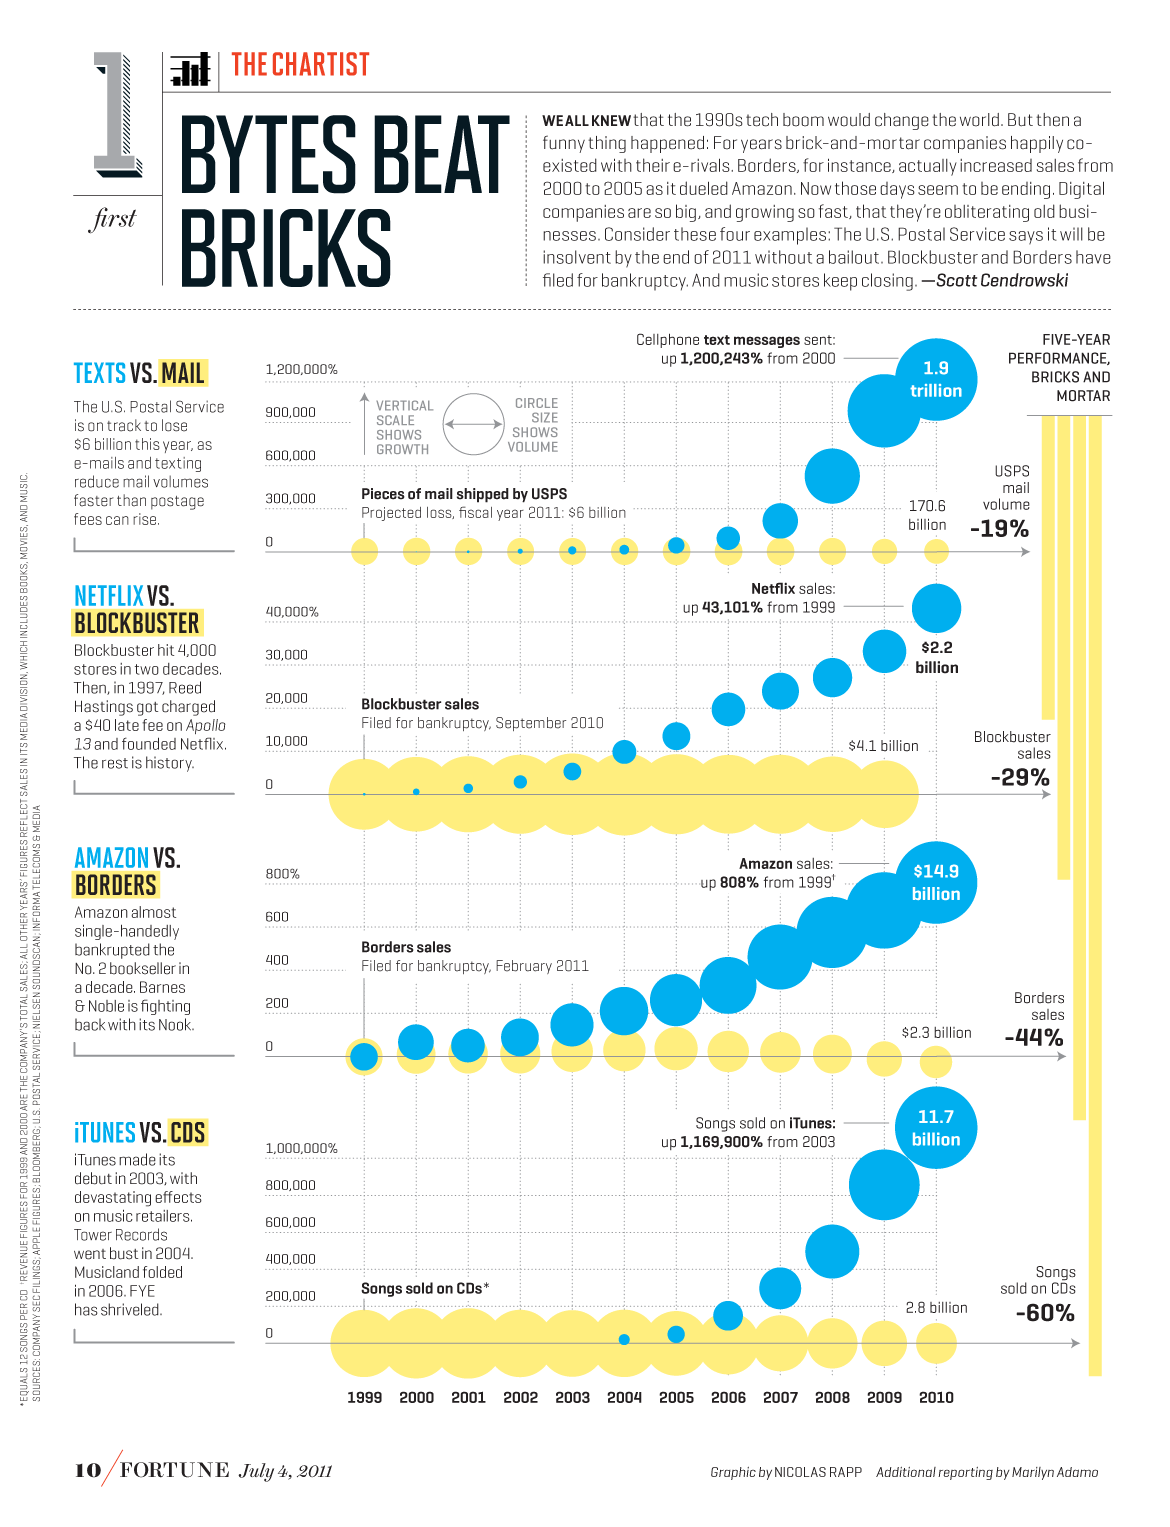
Texts Messages, Amazon, Netflix, and I-Tunes are responsible for Income Inequality in the US. This is what I see in this Infrographic...Can you see it too?

How the "creative" advancement and market implementation of technology has "destroyed" industries over time.  Old jobs destroyed (that's gotta hurt some people) and new jobs emerge (probably not jobs that the first group can perform)---this in a nutshell gives insight into the problem of rising income inequality in the US. Think about the skills required to perform the jobs in each of the compared industries below... It is not the whole story, but there is a link...  
Source: Chartporn

""We all knew that the 1990s tech boom would change the world. But then a funny thing happened: For years brick-and-mortar companies happily coexisted with their e-rivals. Borders, for instance, actually increased sales from 2000 to 2005 as it dueled Amazon. Now those days seem to be ending. Digital companies are so big, and growing so fast, that they’re obliterating old businesses. Consider these four examples: The U.S. Postal Service says it will be insolvent by the end of 2011 without a bailout. Blockbuster and Borders have filed for bankruptcy. And music stores keep closing.""
 

Creative use of Production Possibilities Frontier in regards to heathcare outcomes vs cost between the US and Canada. Regardless of how you feel about the issue, this is informative...

I hesitate to call this a Production Possibilities Frontier (the authors of this study do) because it looks different than the one we use in introductory economics. Appears to me to be somewhat of a supply curve with the output ("Health") on the vertical axis and the inputs ("Resources"--which have a price/cost) on the horizontal axis. But they are smarter than me, so lets go with it. It is a nice illustration of Allocative and Productive Efficiency as applied to health care.
Source: David M. Cutler and Dan P. Ly write of  "The (Paper)Work of Medicine: Understanding International Medical Costs." 
The curve is upward sloping indicating that as we add resources (move to the right from the origin on the horizontal axis) we get positive health outcomes (move up from the origin on the vertical axis). The curve is steep at first, indicating that as more resources are added the returns to health outcomes increase faster relative to the added inputs---Increasing Marginal Returns(see definition). It then flattens out, indicating that as more resources are added the returns to health outcomes start to decrease---Decreasing Marginal Returns (see definition).

There are 3 points identified on the graph "Canada", "Ideal US" and "Actual US". The horizontal difference between "Canada" and "Actual US" is labeled "Allocative (in)Efficiency". This means that to get the SAME health outcomes (point of Vertical axis) as Canada, the US uses more resources to do so---identified with the brackets and labeled "Allocative (in) Efficiency". Resources have a dollar cost, hence to get the same health outcomes as Canada we spend more total dollars.  Allocative Efficiency is achieved when the value consumers place on a good or service (reflected in the price they are willing to pay) equals the cost of the resources used up in production. Condition required is that price = marginal cost. When this condition is satisfied, total economic welfare is maximised."".  All things equal, the price of heath care in the US is more expensive than comparable health care in Canada.

Going in the other direction from "Actual US" to "Ideal US", the gap represented by the bracket shows "Productive (in)Efficiency". Given the resources we allocate to health care we SHOULD be getting more/better health care output/outcomes. This is measured by going from "Ideal US" to a point on the vertical axis. We know we are not getting this level of health care outcomes given the resources used, so we are being productively inefficient in the delivery of health care. Productive Efficiency is achieved when the output is produced at minimum average total cost (AC). For example we might consider whether a business is producing close to the low point of its long run average total cost curve. When this happens the firm is exploiting most of the available economies of scale. Productive efficiency exists when producers minimise the wastage of resources in their production processes.

This graph accompanies a very interesting study (link above) on one of the reasons health care costs are high in the US. The focus is on the administrative costs of delivering health care in the US relative to other countries. Regardless of how you feel about the issue, I encourage you to read the whole thing.  We gotta get real if we want to control the cost of health care now and in the future....

HT: The Conversable Economist

Nice interview with Bill Gates on energy and the environment---He even uses the term Opportunity Costs...NICE!!!

In a discussion on energy, Mr Gates invokes the important economic term "Opportunity Cost". He uses it terms of using land to produce food for either human consumption or energy production.  Trying to solve one problem (clean energy) creates unintended consequences (well, dead people from starvation/malnutrition).  I encourage you to read the whole interview (rather short).  He has some good insights and touches on many behavorial economic concepts as well the state of alternative energy on a macro and micro level. 

Q&A: Bill Gates on the World Energy Crisis

Anderson: When you look at the big picture, where should we be focusing besides nuclear? On massive solar plants in the desert? On middle-size stuff for office roofs? Or is there a reinvention that could be done right in the home?

Gates: If you’re going for cuteness, the stuff in the home is the place to go. It’s really kind of cool to have solar panels on your roof. But if you’re really interested in the energy problem, it’s those big things in the desert.
Rich countries can afford to overpay for things. We can afford to overpay for medicine, we can overpay for energy, we can rig our food prices and overpay for cotton. But in the world where 80 percent of Earth’s population lives, energy is going to be bought where it’s economical. People are going to buy cheap fertilizer so they can grow enough crops to feed themselves, which will be increasingly difficult with climate change.
You have to help the rest of the world get energy at a reasonable price to get anywhere. It’s great to have the rich world, because we’re there to think about long-term problems and fund the R&D. But we get sloppy, because we’re rich. For example, despite often-heard claims to the contrary, ethanol has nothing to do with reducing CO2; it’s just a form of farm subsidy. If you’re using first-class land for biofuels, then you’re competing with the growing of food. And so you’re actually spiking food prices by moving energy production into agriculture. For rich people, this is OK. For poor people, this is a real problem, because their food budget is an extremely high percentage of their income. As we’re pushing these things, poor people are driven from having adequate food to not having adequate food.
The most interesting biofuel efforts avoid using land that’s expensive and has high opportunity costs. They do this by getting onto other types of land, or taking advantage of byproducts that aren’t used in the food chain today, or by intercropping....""
The whole article is HERE...

Sunday, July 24, 2011

Very short lesson on what might happen in a few hours in the US Treasury market if a debt deal is not made (or even if one IS made)...

The Federal government borrows money by issuing US Treasury notes/bills---basically IOU's. I am going to use a very simple example to show how the market for US Treasuries may be affected by the failure to raise the debt limit. Keep in mind these numbers are NOT reflective of true market prices. The math is easier for me that way...

If the govt wants to borrow money they issue one of these Treasury Notes/Bills.  Assume the face value of this Treasury is $1,000 and the current market price for this Treasury is $900 (remember, this does NOT reflect the REAL market AT ALL!).  You buy this bond for $900, so the government in essence has borrowed $900 to spend on whatever they want to spend it on. When you redeem it at maturity you earn $100 over what you paid for it.  Your effective interest rate then was 11.11% ($100/$900 x 100). 

Now, assume the debt limit is not raised and there is perception/eat that the US govt will default on its debt obligations. What is going to happen to the price of US Treasurys now and in the future? We should expect the price to DECREASE as the Demand for them DECREASES. 

Now, for the govt to attract borrowers they will have to LOWER the price of the Treasury to entice people to buy one.  Assume the price is now $800 for a $1,000 Treasury.  So, now the effective interest rate is 25% ($200/$800 X 100)!!

This is what it means when you hear that the borrowing costs for the US government might increase if a deal is not reached.  They will have to accept LESS for each bond issued and pay MORE when they are redeemed.

I hope this helps when the stuff hits the fan in a few hours. The first thing that will be affected will be the price of US Treasuries in the market. 

Note: The demand may fall as I described for US Treasuries BUT the Supply of Treasuries already in circulation could (will ) increase as investors dump them. If the supply increases it has the same effect as demand decreasing, hence the same downward pressure on the price and effect on borrowing costs...

My explanation as to why Social Security Checks WILL go out regardless of what happens with the debt limit. Man, we are gullible!!.

When you (and all other workers subjected to payroll taxes) work, 12.40% of whatever you earn goes to the Social Security Trust Fund (you pay 6.2% and your employer pays 6.2%). For years this amount has exceeded what was needed to pay retirees Social Security checks. The difference in what was brought in and paid out was the then "borrowed" by Congress to spend on wars, bridges, tax breaks, whatever...The S.S. Trust Fund took US Treasury Bonds ("IOU's) in exchange for loaning the surplus money to Congress. This is known as an "Intergovernmental Transfer"--government borrowing from itself. The Trust fund has lots of these bonds, roughly $2.5 Trillion (yes, that is right) worth. They can redeem them as needed.

Assume the debt limit of $14.3 Trillion is met with no extension.  There have been threats that granny may not receive her Social Security check next month.  Let me show you how this is not possible, unless political leaders "choose" (not forced) to do so.

This $2.5T owed to the SS Trust fund is part of the $14.3T national debt accumulated by Congress. If a deal is not reached, EXCLUSIVE of any decision about what to spend or not spend on out of the Federal budget this is what the SS Trust fund can do.

Little less than $60 Billion is paid out in Social Security checks each month.  The SS Trust fund CAN "cash in" $60 Billion of the $2.5T in bonds they hold. The US Treasury is required to take those bonds and credit the SS Trust fund with the proceeds.  The Trust Fund can now cut checks and granny can go to the bingo parlor with no worries...Because the those bonds have been paid off and they were a part of the $14.3T national debt, the national debt DECREASES by $60 Billion BELOW the debt limit.  Now, Congress can borrow $60 billion MORE to meet other obligations and NOT be over the legal debt limit...Rinse and repeat next month...

This is not a long term solution.  The first question that comes to mind is WHERE did the US Treasury get the money (or electronic credits) to pay off the bonds?  Well, they printed/pressed a button.  Inflationary, you say? Perhaps, but inflation is not the biggest problem we face right now.  (Yes, this is kicking a can down the road, but just a DIFFERENT can...)...

The Federal budget problems have to be addressed, but they don't have to be at granny's expense. 

So, when you hear a politician or a talking head on TV tell you Social Security checks won't go out, they are either not informed or they assume you are not and will believe anything...Don't let it be the latter...

Please read this editorial by Thomas Saving that I base this blog entry on...He is not responsible for any of my misinterpretations of his work... :)

Nice graphics showing the difference in employment levels between Texas and California AND the price of moving trucks/vans between the two states..The signs are everywhere...

 
Source: Carpe Diem
 I don't know the number of jobs Texas has "stolen" from California, but I am sure there has been somewhat of a zero-sum result in net gain/loss in jobs between the two states.  One underlying market sign as to what may be happening is the self-moving truck/van market.  From the two graphics I clipped today (July 24th) from the U-Haul website shows a dramatic difference in price depending on which way you are going. There may be other reasons for the difference in price, but I surmise migration for employment opportunities is a major reason...It could NOT possibly be for the social programs Texas has...

Cost to rent a U-Haul Truck to move from Texas to California:


Cost to rent a U-Haul Truck to move from California to Texas:

Saturday, July 23, 2011

Well, if they are just going to snipe at each other, I guess it is up to me to actually explain one of the most important parts of Social Security and Medicare reform...

One of the proposals to slow down the rate of spending, and technically not "cut" benefits, on the two major entitlement programs (Social Security and Medicare) is to go to an alternative measure of prices that reflects substitutes and presumably closer reflects the rise in the cost of living. Exciting, isn't it? Maybe not, but it is a major component to entitlement reform AND almost no one talks about it or explains it.  Here is my superfluous effort...

When the time rolls around for Congress to adjust the amounts (also known as "Indexing")senior citizens receive for Social Security and Medicare benefits, they use the Consumer Price Index(CPI)---a measure of a fixed basket of typical goods and services that the average person might purchase on a daily, weekly, monthly or yearly basis.  If in a time period the market basket costs, say, $100 and in a subsequent time period the SAME basket costs $110, then is can be said prices overall have increased 10%. Congress then can increase the benefits received by senior citizens 10%.

The problem in this measure of prices is the word "fixed".  In the real world, if the price of a good increases consumers seek, and often find, less expensive alternatives. The CPI does not reflect this. In effect the CPI may overstate inflation. Hence, in our example above, if a consumer chooses a less expensive alternative not in the fixed basket then inflation may have increased only to, say, 8%.

Under this new measure, the senior citizen receives an 8% increase in benefits as opposed to 10%.  Voila, proposed spending is reduced by 2 percentage points (or 20%!)...

Hope this helps in seeing the "policy forest" for the "political trees"...

What do the Legislative and Executive Branches of government have in common with the show "Hoarders"? I kinda think everything at this point....

If you have not seen the show "Hoarders" it is about people who have a pathological need to accumulate stuff/junk/trash.  They are unable to give or throw ANYTHING away.  Their houses are crammed full of possessions, including trash. They KNOW they have a problem but they cannot even part with a 2 year old pizza box. 

This is how I see Congress and the discussion on the debt limit and its impact on the Federal budget.  They are hoarders of the things tax money can buy, no matter how ineffective (insert your own despised program here) or counter-productive (ethanol mandate). They know they need to let go of some of the junk, but mentally unable to do so.

Using the Hoarders analogy, this is how I see it:

1. Those on the extreme left want to increase the size of the house (more taxes) so they can hoard more stuff (more government spending) and ignore the illness ("There will always be someone around to pay for this...Right???")
2. Those on the extreme right want to burn the house down--that will teach em'--problem solved ("Oh, wait, I just burned down my own house")
3. Those in the middle want to keep the house (it is a pretty good house---built by some very smart people) but address the problem and pare down the junk (decrease spending) to create more order and functionality. But in order to do that, we might have to buy some boxes and/or shelves to get ourselves organized (raise revenue). ("Don't worry, Be Happy")

As you watch the events unfolding in the next couple of weeks, keep these 3 profiles in mind. Don't you think they peg the political players and their cohorts pretty well?

This reminds me, I have to clean out the garage...and go to Home Depot to buy another useless tool....and Of COURSE, I have to put it on my credit card...

Friday, July 22, 2011

Homeowners---WHY are we ENTITLED to the Home Mortgage Interest Deduction? I really want to know...

Here goes...I live in a house. I got a loan to buy my house. I pay 12 monthly payments to my bank in a calendar years time. Four things are a part of each payment--(1) the principal on my loan, (2) the interest I pay for my loan, (3) property taxes that go to various local governments and (4) payment for homeowners insurance.

The principal is the amount of my loan I actually pay-off on the loan over the year. The bank keeps the interest. The bank submits the money withheld for taxes to the respective local government entities. The banks sends the money collected from me to the insurance company that insures my home.

When I do my Federal income taxes and determine I can itemize deductions (as opposed to taking the "standard deduction"--that is another lesson), I deduct from my taxable income the amount I already paid in taxes to the local governments. This keeps me from being taxed twice on the same income. I get this and it makes total sense.

I can also deduct the INTEREST I paid on my loan that I accrued during the year. This reduces my income that is subject to Federal taxation, hence I pay  less in Federal taxes.  I clearly see how this benefits me. But, WHY am I ENTITLED to this deduction? I know the political reason for this ENTITLEMENT: It is to encourage people to buy homes (voters), perhaps more home than they can afford (that is ANOTHER issue); home builders and real estate agents use it as a selling tool (interest groups, political donors); and doggone it, I have become so use to it I feel ENTITLED to it (voter, again).

So, those of you in my position too, other than it allows us to pay less in taxes, WHY are we ENTITLED to this subsidy/tax break? How can it be justified? Has this subsidy become so ingrained that we feel ENTITLED to it?  Remember, your justification may also be use by someone defending their Subsidy/tax break.

If you did not notice, I believe this has become an ENTITLEMENT for the upper middle class to upper class (especially) of taxpayers.  I have done nothing to receive this subsidy, other than qualify for a loan.

Where am I going wrong?? Respectful in tone responses welcome...
View My Stats