Showing posts with label Perfect Competition. Show all posts

Thursday, September 25, 2014

Corn prices down. My graphs showing how this affects the farmer (AP Micro)

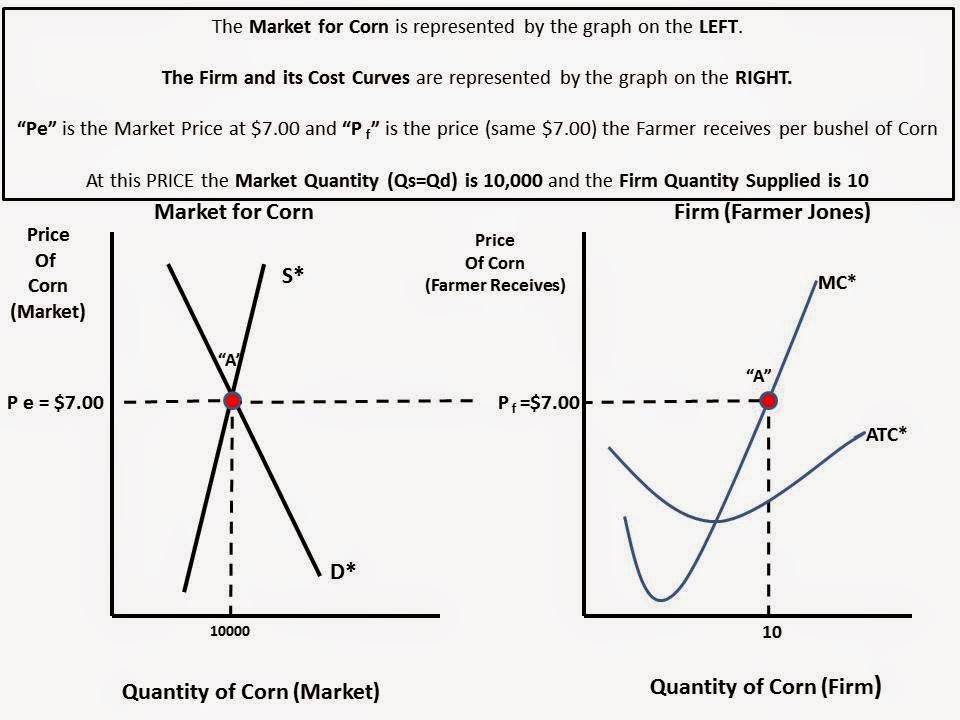
A current event gives me an opportunity to create a series of graphs to illustrate what happens to "Economic Profits"in a market that is considered "Perfectly Competitive" when there is a price decrease AND the cost structure remains relatively constant.
Ohio corn farmers might be producing more crops, but the boom in supply and higher expenses are driving down profits this year. 
Most farmers are reporting they are producing more bushels this year, but the price they're able to get for the commodity has been roughly cut in half compared to last year. 
Western Ohio farmer Tom Tullis said he regularly saw corn prices as high as $6.50 or $7 per bushel as late as last year. But prices this year have been closer to $3. At the same time, operating costs such as machinery and fertilizer have remained high. (Note: I read that "constant")
"It's about half price or below what it was last year," Tullis told the Dayton Daily News (http://bit.ly/1uwu8jN ). "And our inputs are staying pretty much in the same place as far as fertilizer, chemicals and everything else. It's going to be a tough one." 
Most farmers will have enough assets to withstand a tough year or two, said Matt Roberts, an agricultural economist for Ohio State University Extension. The majority of farmers across the state will likely break even this year, Roberts said, although there will be some who lose money."
In the graphs below, I use $7.00 as last years price and $3.50 as this years price.  I use $3.50 as the Average Total Cost (ATC) of producing because it is suggested in the article that farmers are either making a small profit at that level or might even be losing money at that cost. In other words, it is the rough "break-even" point.


Friday, May 30, 2014

I found a Microeconomics Unicorn! See the chart here.

A rare treat for an economics teacher.  A chart that quantifies (not completely but enough) the difference between "Economic Costs" which include opportunity costs (implicit costs) as well as money costs (explicit costs), and "Accounting Costs" which include ONLY money costs. 

Source: USDA ERS

Costs of production for U.S. milk decline as the size of the dairy operation (measured by the number of cows) increases.  Based on 2013 data, average total economic costs of milk production—a measure that includes the opportunity costs of land, labor, and other owned resources—fell by nearly 60 percent, from an average of about $50 per hundredweight (cwt) for producers with fewer than 50 cows to about $20 per cwt for those with 1,000 cows or more. Average costs are lower on larger farms because fixed cost items, such as management, land, and other resource costs, are spread across a larger number of cows, and because average output per cow increases along with farm size. Mean output per cow was just over 15,000 pounds among operations with less than 50 cows, while operations with 1,000 or more head averaged more than 23,000 pounds per cow. Higher milk yields on larger farms stem from factors such as better breeding, nutrition, and health management, as well as the ability to access competitively priced supplies of high quality feed inputs.  This chart is based on data found in Milk Cost of Production Estimates.
 

This is a key concept in AP Microeconomics that is somewhat difficult to convey to high school aged students.

The vertical difference between the RED and BLUE lines represents the Opportunity Costs to the producer for staying in business.

The price or Marginal Revenue (MR) or Average Revenue (AR), a producer receives must at least equal the RED line for her to "Break Even".  

However, she could still make an Accounting Profit at that price.  Is she?

According to the USDA ERS (HERE) the average price for "all classes of milk" was $20.05 per CWT) in 2013.  Now look back at the graph and draw a straight line across the $20.00 mark denoted on the vertical axis.  Compare that to the RED and BLUE lines.

At that price ONLY the large producers (1000 or more milk cows) are Breaking Even in "Economic" terms BUT making profit in "Accounting" terms.

Notice at about 300 cows the average costs start to drop at a relatively steep rate and production increases quickly.  I assume that is the inflection point where economies of scale really kick in.

Hope this helps with teaching and/or learning about this important concept when the topic of a firm that operates in a "Perfectly Competitive" market.

Wednesday, February 26, 2014

Energy use as a Variable Cost. Nice analysis that gives me a chance to GO TO THE GRAPHS! :)

Consumer good manufacturing is a highly competitive industry. There is constant pressure to reduce costs.  Most of the costs producers face are Variable Costs. Variable Costs are costs that vary with production--they tend to increase as more is produced and decrease as less is produced. Bottom line: Variable Costs, well, vary with production (ceterus paribus).


Here is an analysis that centers of energy use in the production process. They suggest that it is an overlooked cost, even though it represents a significant portion of unit costs of producing a good.  With careful analysis and remediation firms in manufacturing could save lots of cost by reducing the use of energy, hence lowering their Variable Costs.

Read the selection (or go read the whole analysis--it is worth the time). The highlights are mine.  Below it I inserted the graph of the firm that operates in a perfectly competitive market and illustrated how the firms cost curves are affected and in turn how production and profitability change.

A nice primer for an AP Microeconomics FRQ!

Bringing lean thinking to energy

Beset by rising costs, resource-intensive manufacturers are applying lean-management thinking in new ways to reduce the amount of energy used in production, to increase resource productivity—or both.

Over the years, many global manufacturers have secured big gains in labor and capital productivity by applying the principles of lean manufacturing. Fewer companies, however, have applied lean know-how to energy productivity. Line workers and even senior managers often consider energy a given when they consider it at all. The waste of energy and resources is typically overlooked or excluded from lean problem solving on the grounds that it is too complex for the front line to address, cuts across too many functions, or both. 
That’s a mistake, given the importance of energy and raw materials as cost drivers. Indeed, for one LCD-television manufacturer we studied, energy represented 45 percent of total production costs. Meanwhile, for many “upstream” manufacturers (such as steel and chemical makers) energy typically accounts for up to 15 percent or more of overall production costs—the largest share after raw materials, which often account for at least 50 percent of the cost base. Our experience suggests that many of these manufacturers could reduce the amount of energy they use in production by as much as 30 percent (with similarly reduced resource losses), in part by applying lean principles and by shifting mind-sets to focus the organization on eliminating anything that doesn’t add value for customers.


Friday, February 14, 2014

Nice article teachers and students can use to analyze Perfect Competition. Corn vs Soybeans. May the be best crop win.

In AP Microeconomics one of the types of market structures we study is of firms that operate in a "Perfectly Competitive" market.  This means: (1) there are many producers, (2) they produce an identical product, (3) there is easy entry and exit from the market, (4) low barriers to entry into the market, (4) the firm is a "price taker". Each individual farmer has no control over the price they receive for what they produce.

Farmers in the agricultural industry are the best (and closest) example to illustrate a Perfectly Competitive Market.

In the article excerpted below (Bloomberg)  a farmer is looking at the price he can receive for growing either corn or soybeans ("Price Taker").  His land is suitable for producing either corn or soybeans ("easy exit from corn, easy entry into soybeans") and it is not costly to switch from one to the other (low barrier of entry--he has the equipment and know-how to grow either).

He has no particular love for either crop.  He is simply measuring what he can receive for each acre planted and harvested against the his cost of planting and harvesting each acre.  The difference is his profit per acre.

This is a great article for teachers and students to show with the two graphs necessary to analyze the perfectly competitive market:  The Firm Graph and the Market Graph.  Both are taken into consideration here.
Soybean Switch on U.S. Corn Farms Expanding World Surplus
Corn is no longer king on Todd Wachtel’s 5,500-acre farm inIllinois. After prices fell to a three-year low in January, he will cut planting by 20 percent in 2014 and devote half his land to soybeans, which are cheaper to grow and just as profitable for the first time in four years. 
Across the Corn Belt, growing the biggest U.S. crop had been an easy choice for farmers since 2009. Annual revenue was $150 per acre more than soybeans on average for Wachtel, who sowed 3,450 acres of corn in 2013, or 63 percent of his land. This year, lower prices mean both crops will earn $10 to $20 an acre, so Wachtel is reducing his risk by sowing more soybeans, which cost $220 less per acre to grow than corn. 
“You are putting less money at risk for the same profit,” Wachtel, 42, said by telephone from Altamont, about 220 miles (354 kilometers) south of Chicago.
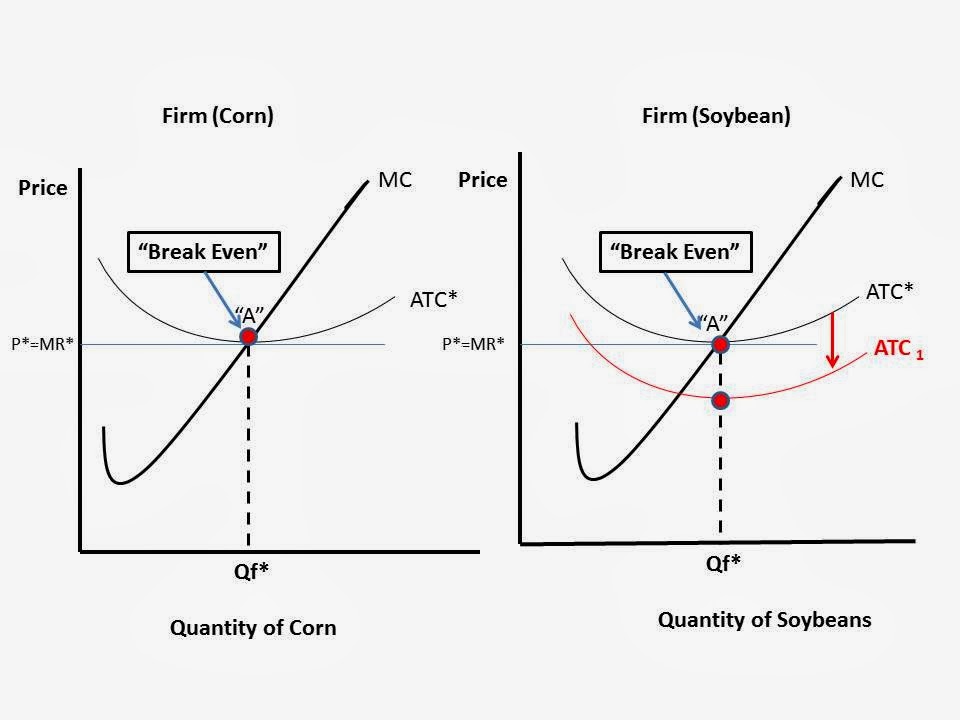
Here are the firm graphs I made to illustrate what is happening.  For simplicity, I am assuming all cost associated with the switch are "Fixed Costs" and will only affect the Average Total Cost ("ATC") of producing.  I did not want to shift the Marginal Cost curve too because it complicates things.  If I did it would show the MC curve shifting to the RIGHT and the Quantity of Soybeans would increase, just as the article states.

The Price the farmer receives is the same for either crop (as mentioned in the article) at "P*=MR*) but his cost of producing soybeans is LESS than the cost of producing Corn per acre.

Ceterus Paribus, the ATC curve for soybeans shifts DOWN and the farmer is now making some economic profits in soybeans as compared to "Breaking Even" when he produces Corn.


View My Stats