Showing posts with label Education. Show all posts

Tuesday, September 9, 2014

Education Spending in the OECD countries. How does the US stack up against the rest?

This terrific interactive is from the OECD website, the statistic gathering arm of the European Union.

See how various countries stack up in terms of spending on the various levels of education--from Pre-K through College ("Tertiary").

The BLUE line is the OECD average among the countries you see listed below.

The other tabs along the top offer interesting information regarding educational attainment.  This resource can be used for all kinds of analysis students could do in small discusssion groups.


Tuesday, May 27, 2014

Nice graph(s) putting Student Debt levels since 2005 in perspective

From the St Louis Federal Reserve ("The Share of Borrowers with High Student Loan Balances is Rising")

The top graph shows the ratio of outstanding student debt in a particular year to the debt level in 2005. For example, take the time period of between 2011 and 2012 (I inserted an RED vertical line).

Total Student Debt (top green line) was 2 times what it was in 2005.

The number of debtors is about 1.58 times more than in 2005.

The average balances held by debtors was about 1.3 times as much as those in 2005.


The bottom bar chart shows, in percent form, the change in debt levels from students in 2005 and 2012.

In 2005 about 56% of student loan balances were $10,000 or less (darker bar). In 2012--40% (lighter bar)---PROGRESS, right!! Not so fast.

The difference essentially moved to the higher average debt levels.  Notice the light bars get significantly higher than the dark bars as average debt levels increase, showing a larger (1) nominal change and more importantly (2) a significant percentage change from one time period to another.

For instance, the change in average balances in the $25K-$50K went from 11% to 18% (eye-balling).  That is a 7% percentage point increase, but NOT a 7% increase in average loan balance. The percentage increase would be (18% - 11% = 7% and 7%/11% X 100) +64%.

If you are already in college you are well aware of this.

If you are thinking of going to college you should be aware of this.

If you are a teacher of High School students you should be aware of this AND make your students aware of it also.

Hope this helps.

Wednesday, March 20, 2013

Why are women obtaining college degrees at a much higher rate than men? Do the guys need a little extra help??

I saw this graphic in an article at The Atlantic illustrating the "colleg degree gap" between men and women in cities/metropolitan areas around the US.  The article is very interesting. Worth a read.

I have to admit, the disparity took me a bit by surprise.  As of 2011, as a percentage, women earned 27% more college degrees than men earned (36.1% - 28.4%/28.4% X 100). That seems statistically significant, even to a high school economics teacher.

What are the social implications, if any, of this trend? Do we need more Affirmative Action policies for men from all the groups listed below? 
Source: The Atlantic

Sunday, August 19, 2012

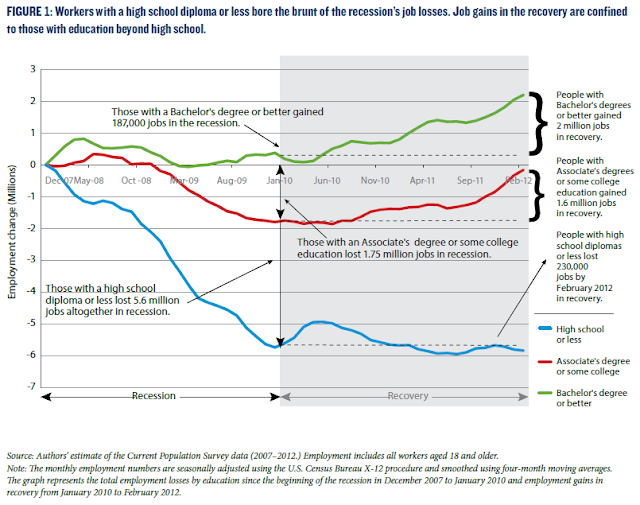
Teachers: If you need a quick visual to emphasize to students the link between education and employment show them these graphs. Students: If you need a reminder as to the importance of education and future employment, PLEASE look at these too.

There is a lot going on in this first graph, but it is important to know what is happening.

The vertical axis shows the percentage change in employment (jobs gained) since the official start of the Great Recession, through the official end of the recession (everything to the left of Jan 2010) and finally through the "recovery" to the present (everything in blue).

Note the bold brackets to the right showing the numerical change in jobs based on the level of education a worker has. 

More education does not guarantee you anything but statistically you are more likely to (1) find a job, (2) not lose your job, (3) if you do lose your job you are more likely to find another one in a shorter period of time.

Source: KPC


 This second graph shows the value of education over an extended period of time--since 1989.

Dropping out or even finishing high school is not enough. ANY type of additional education will help you gain skills that make you more valuable to employers. 

Source: KPC

Monday, August 13, 2012

Nice infographic on education spending in the US. I think we spend too much (over-all). How about you??


Well, at least relative to other countries.  Here are some facts and figures about Education Spending in the US and some comparisons with other countries.  We spend more on education than other industrialized economy's, but seemingly get worse outcomes.

Human Capital is how economies are going to develop from now on.  Advancements in technology and improved processes are a given.  How people adapt and take advantage of these changes will dictate the quality of life in the future.

Education, or "skill acquisition", will become more important than it is today.

Below the inforgraphic are 10 bullet points with brief explanations of each. If you click on the link it will take you to source articles and/or research papers with more details. This is a great resource if you are doing a paper for school!!


Infrographic Source: Online Colleges
  1. The U.S. spends more than any other nation on education.

Each year, the United States shells out billions of dollars on education. In 2010, the total annual spending on education was more than $809 billion dollars. That’s more than any other industrialized nation, and more than the spending of France, Germany, Japan, Brazil, the U. K., Canada, and Australia combined. The difference is substantial when you look at annual spending per child as well. In the U.S., the average student costs the government about $7,743. The next highest nation is the United Kingdom, with $5,834 per student, a difference of almost $2,000 a year per student. So what do top performing nations like Finland and South Korea spend? Just $5,653 and $3,759 per student, respectively.

2. Yet, math and science scores for U.S. students are substantially lower than many other nations.

When it comes to getting students to learn more and perform better in school, it isn’t purely an issue of collective education spending. While the U.S. spends more than any other nation on education, its test scores don’t reflect the average spending per student. On math tests, American students score an average of 474 on a 600 point scale, doing slightly better on science with an average score of 489. By comparison, Canadian students scored an average of 527 and 534 on the same tests, and Finnish students dominated the pack scoring 548 and 563. Of course, these are just averages. Students in affluent suburban districts score much higher than their poorer, urban counterparts, which leads us to our next point

3. Educational spending is often inconsistent.

Educational dollars in the U.S. aren’t always fairly allocated. Students coming from the most high-need, desperate situations often don’t have access to good-quality schools, resources, and experienced teachers. Part of that has to do with inconsistent allocation of educational funds. Recent studies have found that school districts commonly distribute different amounts of funding to individual schools within the district, even those serving the same types of students. Many schools get less money for funding teacher salaries, which means they can’t afford to hire experienced teachers, a problem that’s further compounded by receiving lower amounts of unrestricted spending, leaving schools without a way to make up the difference. A study of Houston-area schools found that schools just miles apart had vast differences in funding, with some receiving $18,027 per student and others just $4,800. While some schools with high funding were successful, others were failing, demonstrating that money doesn’t always determine educational outcomes (though it usually doesn’t hurt).

4.More money isn’t always the solution, but better allocation of it can be.

Simply giving more funding to schools that are struggling or failing hasn’t proven to be a reliable solution to America’s educational problems. What does matter, however, is how that education funding is spent. A review of California schools in 2007 found no relationship between spending and student outcomes stating that more funding wouldn’t make a difference until “extensive and systematic reforms” were made. What does that mean? It means that many of the major problems with education in the state, and possibly nationwide, stem from the illogical and wasteful ways school funding is spent than from lack of money. In fact, the study suggested that even in under performing inner city schools, students would see a much greater benefit from reforms than from simply increasing spending.

5. Education spending can have far-reaching economic effects.

Attending a high-quality, well-funded school can be one of the best gifts a young person can receive in life. Why? Because a solid elementary and secondary education has some far-reaching effects that can resonate throughout life. Those who attend quality schools are more likely to choose additional education throughout their lives and in turn are likely to make more than their peers who attended lower quality schools. Of course, education spending itself isn’t what separates a high-quality school from a low-quality one, but it does allow schools greater freedom to provide resources, extracurriculars, technology, experienced teachers, and arts and science education to students, the impact of which isn’t insignificant.

6.Teacher pay does matter.
Over the past few years, teachers have been hit hard by accusations that they’re overpaid and that they put an undue strain on state finances. Yet studies show that teacher pay does make a difference in improving educational outcomes for students and for improving the quality of education in America as a whole. In fact, teacher pay is uncompetitive with that offered by other professions, and the economic penalty teachers pay for their chosen profession increases the longer they stay on the job. As a result, many of the best teachers leave the teaching profession or never enter it in the first place. Consider these stats: every year 20% of teachers in urban districts quit, 46% of teachers quit before their fifth year, and the turnover costs associated with this costs the U.S. $7.34 billion every year. Lower pay means fewer top performing individuals are attracted to the profession and that more high-quality, experienced teachers leave, which has had a marked effect on education quality, especially in poor, urban schools.

7. The more money people have, the more they spend on education.

Education spending isn’t just an issue for the state and federal government; it affects individuals, too. As you might have guessed, those who come from the upper income brackets spend more on education than those in lower income brackets, probably largely because they have the resources to be able to do so. This can have a significant impact on the long-term academic and professional success of students, as parents who can afford to invest in tutoring, extra classes, and high-quality colleges generally have students who perform better than their peers. This can create an enormous gap between well-off students and their less well-off peers, before state and federal school spending is even taken into account.

8. Charter schools aren’t cure-alls for education woes.

Many cities struggling to deal with failing schools are investing millions of state dollars into funding charter schools. While some of these schools have seen success, they’re not necessarily the perfect solution to America’s bigger educational problems. Charter schools can kick out students that don’t measure up, don’t allow teachers to join unions which keeps their pay low, and as studies are finding, spending less money on students and more money on education than their public school counterparts. A study by the National Center for the Study of Privatization in Education found that charter schools spend less on instruction, even when controlling for other factors, finding a $1,140 discrepancy in spending on average. (It is important to note, however, that these results were not found at all charters schools, and some spent considerably more than their public counterparts.) The major problem with sending public money to the private charters, suggests the study, is the lack of transparency among some charter management organizations, making it hard to tell where funding is going.

9. The biggest return on investment in education spending comes from spending more on the lowest achieving students.

While high-performing and average students certainly should receive their fair share of educational funding and resources, studies suggest that education spending has the biggest impact when it’s focused on students who are below the status quo. Why? Because helping these students excel in school and beyond can have a big economic impact further down the road. Elite colleges and universities receive millions in funding every year, but those are schools that some students can’t even dream of attending and with little financial assistance or motivation, they often end up in dead end jobs, on welfare, or even in jail. Happily, the funding tide seems to be slowly changing, with Obama pledging billions in funding to community colleges and technical schools, providing greater economic opportunities for all, not just the top performers.

10.The earlier money is spent on education, the better the investment.

While there is much debate and confusion about the best way to reform education, one thing numerous studies point to and that most experts can agree on is that the earlier students receive high quality education, the better. A study at the German Institute for Economic Research found that immigrant children who attended public kindergarten were 25% more likely to go on to a pre-university track of study. A study at the University of Chicago found that preschool programs for disadvantaged kids generate a 16% annual rate of return on an initial $10,000 investment. Why such a big gain? These students are more likely to get good grades, stay in school, go to college, and enjoy higher lifetime earnings. They’re also less likely to go to jail and go on welfare, which means both society and the individual students reap the economic benefits of smart, early educational spending.

Thursday, August 9, 2012

Three over-arching reasons why US students perform below other countries on academic assessment tests. Do you agree or disagree? Does it matter?

Below are three conclusions from Martin West, a professor at the Harvard Graduate School of Education, regarding the 2009 Program for International Student Assessment (PISA) exam that was given to a sample of students around the world. As always, be aware of an authors biases when interpreting data. HERE are the results of the test. (HT: Conversable Economist for this blog subject)

The over-arching themes for each one are interesting to me.  The first two certainly go against much of the conventional wisdom as practiced in the US. Specifically, we place too much emphasis on testing and the tension we have in the Public vs Private (or, in the middle, Charter) debate.  He hurt my feelings with the 3rd one, so I won't address that one---LOL!

What do you think? Is he on or off the mark? 

What are some common factors across the other countries where the education systems seem to be outperforming the U.S. education system? (The question is posed by Tim Taylor)
1. Exit exams. Perhaps the best-documented factor is that students perform at higher levels in countries (and in regions within countries) with externally administered, curriculum-based exams at the completion of secondary schooling that carry significant consequences for students of all ability levels. Although many states in the United States now require students to pass an exam in order to receive a high-school diploma, these tests are typically designed to assess minimum competency in math and reading and are all but irrelevant to students elsewhere in the performance distribution. In contrast, exit exams in many European and Asian countries cover a broader swath of the curriculum, play a central role in determining students’ post secondary options, and carry significant weight in the labor market. As a result, these systems provide strong incentives for student effort and valuable information to parents and other stakeholders about the relative performance of secondary schools. The most rigorous available evidence indicates that math and science achievement is a full grade-level equivalent higher in countries with such an exam system in the relevant subject.

2. Private-school competition. Countries vary widely in the extent to which they make use of the private sector to provide public education. In countries such as Belgium, the Netherlands, and (more recently) Sweden, for example, private schools receive government subsidies for each student enrolled equivalent to the level of funding received by state-run schools. Because private schools in these countries are more heavily regulated than those in the United States, they more closely resemble U.S. charter schools, although they typically have a distinctive religious character. In theory, government funding for private schools can provide families of all income levels with a broader range of options and subject the state-run school system to increased competition from alternative providers. Rigorous studies confirm that students in countries that for historical reasons have a larger share of students in private schools perform at higher levels on international assessments while spending less on primary and secondary education. Such evidence suggests that competition can spur school productivity. In addition, the achievement gap between socioeconomically disadvantaged and advantaged students is reduced in countries in which private schools receive more government funds.

3. High-ability teachers. Much attention has recently been devoted to the fact that several of the highest-performing countries internationally draw their teachers disproportionately from the top third of all students completing college degrees. This contrasts sharply with recruitment patterns in the United States. Given the strong evidence that teacher effectiveness is the most important school-based determinant of student achievement, this factor probably plays a decisive role in the success of the highest-performing countries. Unfortunately, as education economist Dan Goldhaber of the University of Washington has pointed out, the differences in teacher policies across countries that have been documented to date “do not point toward a consensus about the types of policies—or even sets of policies—that might ensure a high-quality teacher workforce.”

Friday, August 19, 2011

Results of a Gallup Poll on how people view their childs school relative to other schools around them.

Is this a case of cognitive dissonance?  People surveyed tend to rate their own childs school highly while the other schools in their area are viewed as a cut below (or many cuts below).  I think it is because we are more aware of what goes on in our schools and tend to take ownership of it because it is more personal.  Or is it simply more of a comfort thing---it HAS to be good/fine/ok because I trust them with my child. 

How can the public simultaneously like their own school, but not have a positive view of everone elses school?  This is similar to our views on politicians---everyone loves their own, but thinks Congress as a whole is broken.  How do we reconcile the two?  Maybe we ARE crazy....
Source: Gallup Poll

As an aside: Why did the percentage of people expressing a positive view of their childs school spike from 2007 to 2008? That is a 58% increase!  It was the first year of the recession.  I cannot think of a good reason, can you?

Tuesday, August 2, 2011

Nice graph contrasting educational attainment and employment levels. I also see income inequality, don't you?

It is generally accepted that the mantra "the more you learn, the more you earn" is still valid even in our changing economy. Perhaps more so now.  How much of the increasing income gap in the US can be attributed to the "knowledge gap". The graph below contrasts college graduates (use scale numbers of the left) with high school dropouts(use number scale on the right) and their respective employment levels. These represent the extreme ends of educational attainment, so you have to assume the other levels (HS grad, some college, Associates Degree, Trade School, etc) are somewhere in between.  Notice the relatively constant upward trajectory for college graduates--I see an explicit knowledge gap and an implicit income gap. 
Source: Carpe Diem
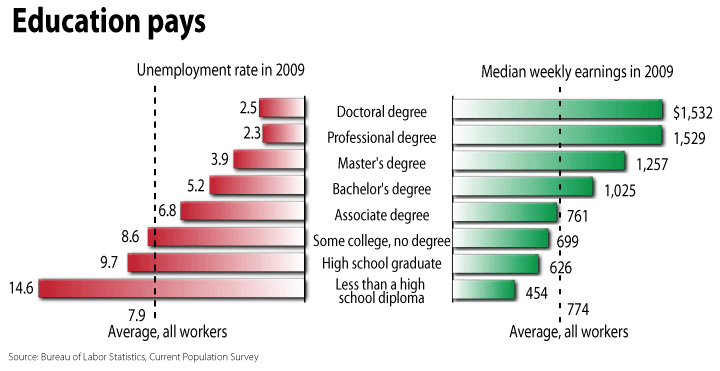
In the chart below, look at the income data on the right. While this is just a snapshot of income comparison in one year, I am going to go out on a limb and guess if you take data 15 years before and 3 years after 2009 you will find the same trend---increasing income inequality based on level of education. 
Source: Wikipedia

Tuesday, July 26, 2011

College and Cigarettes---What do they have in common? You smoke one (but DON'T!) and the other smokes you (well, at least your wallet)...

Well, they both burn though your money--one figuratively and one literally.  Since 1970 the cost of attending higher education has increased 1,000%, medical care approx 550%, housing approx 420% and the price level of ALL things measured in the Consumer Price Index (including the items already mentioned) approx 375%. Do you ever ask yourself WHY college, overtime, has increased in price much more relative to ANYTHING else in the economy? Opps, an exception below...
Source: Carpe Diem

Cigarettes and tobacco products have increased more. We know that is because taxes have increased on those products significantly. Higher education is not heavily tax, BUT it is heavily subsidized. It that the root of the problem? We all know how much we PAY for college, but I believe no one knows how much it actually COSTS. Those are two different concepts.

Sunday, July 3, 2011

Colleges are accepting more out-of-state students for admissions for the extra money. Does this mean the admittance of FEWER in-state students? There HAS to be some impact "at the margin", right? See interesting statistics here...

Interesting college admissions numbers from California. The acceptance of out-of-state (Foreign students included in this statistic too) has increased dramatically just in one year. As high as a 100% increase and some schools. With budget cuts, they are aggressively accepting more out of states students than they may have otherwise.  The obvious reason is out of state students pay a much higher tuition rate BUT do not cost anymore than an in-state student.  A negative---Does this potentially "crowed out" the admissions of in-state students seeking admittance to a California college/university?  A positive---does this allow the university system to keep tuition rates lower for California residents than they otherwise would be, even at the expense of admitting fewer in-state students?

Source: Matthew Yglesias
HT: Mattew Yglesias
View My Stats