Showing posts with label Foreign Exchange. Show all posts
Showing posts with label Foreign Exchange. Show all posts
Tuesday, August 15, 2017
Wording for Correct answers for Foreign Exchange Market (FOREX) on the AP Macroeconomics FRQ's
On the AP Macroeconomics exam you can be 99% certain you will be asked Foreign Exchange Market question(s) on the FRQ section of the test.
Precise and to the point answers are required. They are looking for the proper linkages from the various cause and effect scenarios you are presented with.
Below I wrote out what would be the "best way" to respond to these questions. You may be asked to identify and explain ALL the effects under each bullet point or maybe just one (for example, only what happens to Exports given an event---all the rest is implied and you have to understand it in order to get to what happens to Exports).
My advice is to memorize these until they "click". Again, they contain ALL the key words/phrases that past FRQ rubics have required students explicitly mention.
NOTES: BE CAREFUL with #3 through #6. They seem very counter-intuitive what happens to the value of the dollar given the scenario. These can easily trip you up.
Precise and to the point answers are required. They are looking for the proper linkages from the various cause and effect scenarios you are presented with.
Below I wrote out what would be the "best way" to respond to these questions. You may be asked to identify and explain ALL the effects under each bullet point or maybe just one (for example, only what happens to Exports given an event---all the rest is implied and you have to understand it in order to get to what happens to Exports).
My advice is to memorize these until they "click". Again, they contain ALL the key words/phrases that past FRQ rubics have required students explicitly mention.
NOTES: BE CAREFUL with #3 through #6. They seem very counter-intuitive what happens to the value of the dollar given the scenario. These can easily trip you up.
1. “If the interest rate in the U.S. INCREASES relative to the Rest of the World (ROW), U.S. financial assets become more desirable. The demand for the dollars INCREASES and APPRECIATES the value of the dollar internationally. “
Effect on Exports: When the dollar APPRECIATES in value, U.S. goods and services become relatively MORE expensive and Exports will DECREASE.
Effect of Imports: When the dollar APPRECIATES in value, Foreign goods and services become relatively LESS expensive and Imports will INCREASE.
Effect on Net Exports (N(x): If Exports Decrease and Imports Increase, then net exports will DECREASE.
2. “If the interest rate in the U.S. DECREASES relative to the Rest of the World (ROW), U.S. financial assets become less desirable. The supply of the dollars INCREASES and DEPRECIATES the value of the dollar internationally. “
Effect on Exports: When the dollar DEPRECIATES in value, U.S. goods and services become relatively LESS expensive and Exports will INCREASE.
Effect of Imports: When the dollar DEPRECIATES in value, Foreign goods and services become relatively MORE expensive and Imports will DECREASE.
Effect on Net Exports (N(x): If Exports Increase and Imports Decrease, then net exports will INCREASE.
3. If price levels in U.S. are LOWER relative to Rest of the World (ROW) then U.S. goods and services become MORE desirable. The demand for the dollars INCREASES and APPRECIATES the value of the dollar internationally. “
Effect on Exports: When the dollar APPRECIATES in value, U.S. goods and services become relatively MORE expensive and Exports will DECREASE.
Effect of Imports: When the dollar APPRECIATES in value, Foreign goods and services become relatively LESS expensive and Imports will INCREASE.
Effect on Net Exports (N(x): If Exports Decrease and Imports Increase, then net exports will DECREASE.
4. If price levels in U.S. are HIGHER relative to Rest of the World (ROW) then Foreign goods and services become MORE desirable. The supply of dollars INCREASES and DEPRECIATES the value of the dollar internationally.
Effect on Exports: When the dollar DEPRECIATES in value, U.S. goods and services become relatively LESS expensive and Exports will INCREASE.
Effect of Imports: When the dollar DEPRECIATES in value, Foreign goods and services become relatively MORE expensive and Imports will DECREASE.
Effect on Net Exports (N(x): If Exports Increase and Imports Decrease, then net exports will INCREASE.
5. If GDP INCREASES in the U.S. relative to the Rest of the World, then Americans will want to buy not only MORE domestic goods/services, but MORE foreign goods/services also. The supply of dollars INCREASES and DEPRECIATES the value of the dollar internationally.
Effect on Exports: When the dollar DEPRECIATES in value, U.S. goods and services become relatively LESS expensive and Exports will INCREASE.
Effect of Imports: When the dollar DEPRECIATES in value, Foreign goods and services become relatively MORE expensive and Imports will DECREASE.
Effect on Net Exports (N(x): If Exports Increase and Imports Decrease, then net exports will INCREASE.
6. If GDP DECREASES in the US relative to the Rest of the World. then Americans will not only buy FEWER domestic goods/services, but FEWER Foreign goods/services also. The supply of dollars DECREASES and APPRECIATES the value of the dollar internationally.
Effect on Exports: When the dollar APPRECIATES in value, U.S. goods and services become relatively MORE expensive and Exports will DECREASE.
Effect of Imports: When the dollar APPRECIATES in value, Foreign goods and services become relatively LESS expensive and Imports will INCREASE.
Effect on Net Exports (N(x): If Exports Decrease and Imports Increase, then net exports will DECREASE.
Wednesday, August 3, 2016
UK minimum wage pre and post-Brexit. How has it changed?
There is always a debate about the appropriate level at which the minimum wage should be set (or even if there should be one).
International comparisons are often used to see how other countries approach the use of it as a policy tool.
Here is how the U.K. deals with the issue. They have what is called a "tier" approach---a different minimum wage for different age groups and/or skill levels.
Of course the wages are in Sterling Pound, the currency of the UK. We know with "Brexit" the value of the Pound has taken a hit over the course of the last month or so.
For the purposes of understanding how making cross border comparisons can be tricky, let's put the a above numbers in the current exchange rate, exchange rate before Brexit and Purchasing Power Parity (PPP) exchange rate.
Before the effects of Brexit hit the market, the Pound was trading at roughly $1.45. So if you take the above wage rates and multiply them by $1.45 that will give you the US dollar value of the minimum wage for that particular age/skill group.
For 25 and over: $10.44. For 21-24: $9.72. For 18-20: $7.69. For under 18: $5.61. Apprentice: $4.79
Today, the exchange rate is 1 Pound = $1.33. Again, take the numbers in the chart above and multiply by $1.33.
For 25 and over: $9.58. For 21-24: $8.91. For 18-20: $7.04. For under 18: $5.15. Apprentice: $4.39.
Quite a difference! The only thing that changed is the exchange rate between the Dollar and the Pound in a relatively short period of time. You can see how using current exchange rates can present a misleading picture when presented in current exchange rates.
Fortunately we have a better, but not necessarily perfect, way to show the differences in currency exchange rates. It is called Purchasing Power Parity (PPP). PPP is the economists preferred exchange rate to use when making international comparisons because it takes country specific prices/price level into consideration.
In many cases the PPP exchange rate varies drastically in comparison to market exchange rates.
In the case of the UK, data from the OECD show the PPP rate to be almost identical (1 cent less) to the pre-Brexit market exchange rate: $.144 (See the data here). The numbers I calculated above for "pre-Brexit" will only be slightly less given the PPP exchange rate.
The US has minimum wage has some exceptions but for the most part, regardless of age and/or skill level, it is a blanket $7.25 per hour. You can see how this falls into the UK policy scheme.
So, when someone quotes a foreign country's minimum wage in dollars it is critical to know (1) if that it is in current dollars how has that currency faired lately in the foreign exchange market and (2) is that in market dollars or in PPP?
Then judge by the look on their face if they are as informed as you or not. :)
International comparisons are often used to see how other countries approach the use of it as a policy tool.
Here is how the U.K. deals with the issue. They have what is called a "tier" approach---a different minimum wage for different age groups and/or skill levels.
 |
| From UK.gov |
For the purposes of understanding how making cross border comparisons can be tricky, let's put the a above numbers in the current exchange rate, exchange rate before Brexit and Purchasing Power Parity (PPP) exchange rate.
Before the effects of Brexit hit the market, the Pound was trading at roughly $1.45. So if you take the above wage rates and multiply them by $1.45 that will give you the US dollar value of the minimum wage for that particular age/skill group.
For 25 and over: $10.44. For 21-24: $9.72. For 18-20: $7.69. For under 18: $5.61. Apprentice: $4.79
Today, the exchange rate is 1 Pound = $1.33. Again, take the numbers in the chart above and multiply by $1.33.
For 25 and over: $9.58. For 21-24: $8.91. For 18-20: $7.04. For under 18: $5.15. Apprentice: $4.39.
Quite a difference! The only thing that changed is the exchange rate between the Dollar and the Pound in a relatively short period of time. You can see how using current exchange rates can present a misleading picture when presented in current exchange rates.
Fortunately we have a better, but not necessarily perfect, way to show the differences in currency exchange rates. It is called Purchasing Power Parity (PPP). PPP is the economists preferred exchange rate to use when making international comparisons because it takes country specific prices/price level into consideration.
In many cases the PPP exchange rate varies drastically in comparison to market exchange rates.
In the case of the UK, data from the OECD show the PPP rate to be almost identical (1 cent less) to the pre-Brexit market exchange rate: $.144 (See the data here). The numbers I calculated above for "pre-Brexit" will only be slightly less given the PPP exchange rate.
The US has minimum wage has some exceptions but for the most part, regardless of age and/or skill level, it is a blanket $7.25 per hour. You can see how this falls into the UK policy scheme.
So, when someone quotes a foreign country's minimum wage in dollars it is critical to know (1) if that it is in current dollars how has that currency faired lately in the foreign exchange market and (2) is that in market dollars or in PPP?
Then judge by the look on their face if they are as informed as you or not. :)
Friday, July 1, 2016
Brexit and exchange rates. A simple example.
Another short example of the effect "Brexit" has on trade in terms of the export and import of a finished goods from the UK .
The British Pound Sterling just before Brexit was trading at $1.45 (approx)---To "buy" one Pound you had to "pay" $1.45US for it.
So, if you wanted to buy a good in the UK that was priced at 100 Pounds, you had to give up $145.00US dollars to purchase it.
Today post-Brexit the exchange rate is $1.33. So to buy that same good for 100 Pounds, you would only have to give up $133.00. Due to the change in the exchange rate, the UK is "on sale"---you save $12.00 or 8.3%.
Ceteris Paribus, this will serve to INCREASE imports to the US from the UK (vice versa, exports will INCREASE for the UK) for those holding US dollars---Law of Demand--as price goes down, quantity demanded increases.
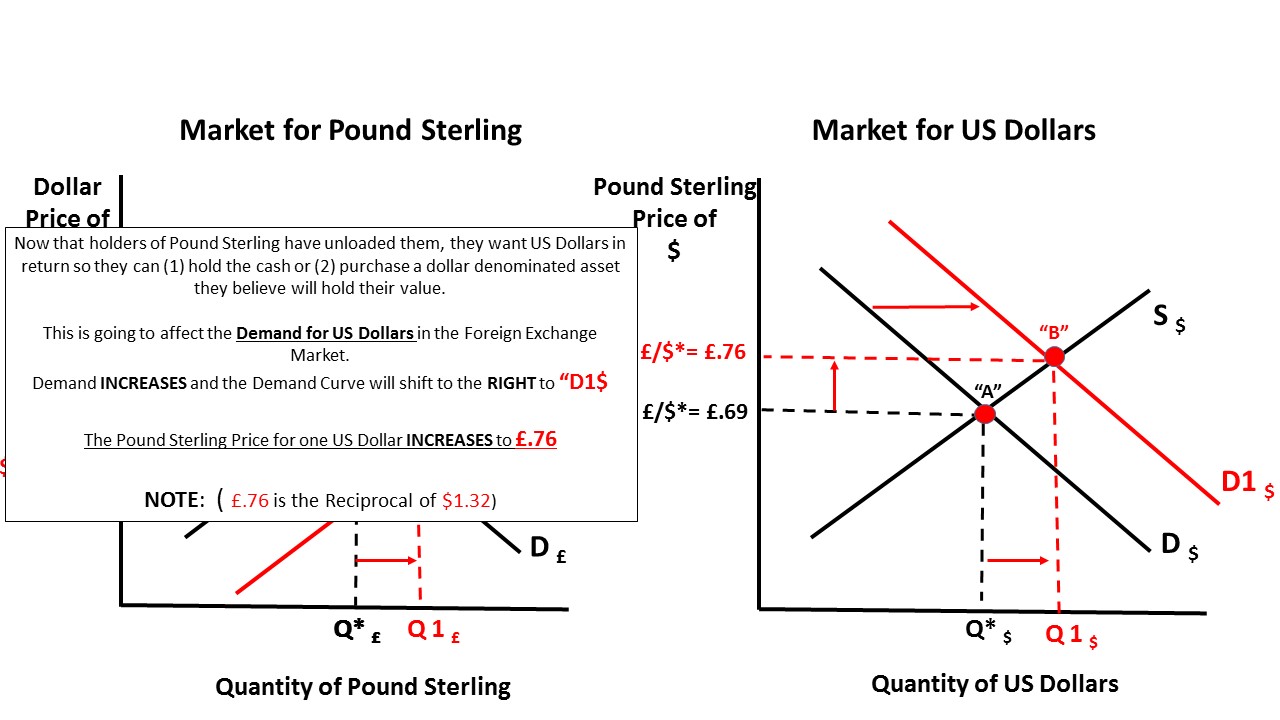
So, how about in the other direction? Before Brexit, for Brits to "buy" one US Dollar they had to "pay" .69 of Pound to purchase it (this is the reciprocal of the $1.45 from above).
If a Brit wanted to buy a good in the US that was priced at $100 Dollars, they would have to give up 69 Pounds to buy it.
Today, post-Brexit the exchange rate is .75 pounds (reciprocal of $1.33). To buy that $100 Dollar good now costs the Brit 75 Pounds. Due to the exchange rate, the US is now more costly. Brits pay 6 Pounds or 8.7% more.
Ceteris Paribus, this will serve to DECREASE exports from the US (and DECREASE imports to the UK) for those holding Pound Sterling---Law of Demand---price increases, quantity demanded decreases.
Bottom line: British Jaguars are less expensive so the US may/will IMPORT more of them and the British may/will EXPORT more of them. US Cadillacs are more expensive so the US may/will EXPORT less of them and the British may/will IMPORT fewer of them.
Trade as illustrated by changes in the exchange rate(s). Hope this helps!
The British Pound Sterling just before Brexit was trading at $1.45 (approx)---To "buy" one Pound you had to "pay" $1.45US for it.
So, if you wanted to buy a good in the UK that was priced at 100 Pounds, you had to give up $145.00US dollars to purchase it.
Today post-Brexit the exchange rate is $1.33. So to buy that same good for 100 Pounds, you would only have to give up $133.00. Due to the change in the exchange rate, the UK is "on sale"---you save $12.00 or 8.3%.
Ceteris Paribus, this will serve to INCREASE imports to the US from the UK (vice versa, exports will INCREASE for the UK) for those holding US dollars---Law of Demand--as price goes down, quantity demanded increases.
So, how about in the other direction? Before Brexit, for Brits to "buy" one US Dollar they had to "pay" .69 of Pound to purchase it (this is the reciprocal of the $1.45 from above).
If a Brit wanted to buy a good in the US that was priced at $100 Dollars, they would have to give up 69 Pounds to buy it.
Today, post-Brexit the exchange rate is .75 pounds (reciprocal of $1.33). To buy that $100 Dollar good now costs the Brit 75 Pounds. Due to the exchange rate, the US is now more costly. Brits pay 6 Pounds or 8.7% more.
Ceteris Paribus, this will serve to DECREASE exports from the US (and DECREASE imports to the UK) for those holding Pound Sterling---Law of Demand---price increases, quantity demanded decreases.
Bottom line: British Jaguars are less expensive so the US may/will IMPORT more of them and the British may/will EXPORT more of them. US Cadillacs are more expensive so the US may/will EXPORT less of them and the British may/will IMPORT fewer of them.
Trade as illustrated by changes in the exchange rate(s). Hope this helps!
Tuesday, June 28, 2016
Brexit offers an opportunity for a short FOREX lesson.
The British Pound Sterling has taken a beating in the span of a few short days. It went from about $1.46 (at times higher) to a low of $1.32.
Much of the commentary has been about holders of Pounds fleeing the currency and into a "safehaven". This means they are exchanging Pounds for other currencies in order to (1) hold cash in that currency or (2) purchasing a safe(r) asset with that currency (gold, bonds, etc).
The Foreign Exchange Market is a big part of the AP Macroeconomics curriculum. It is one of the harder things to teach and I think one of the more difficult things for students to grasp. After all, it is not something we routinely encounter in daily life BUT it does make its presence known in all facets of our economic lives.
Below I put together some slides illustrating a part of what happened with "BREXIT" in the UK and how students should understand the graphing elements as it pertains to an AP Macro class.
Hope it helps!!!


Much of the commentary has been about holders of Pounds fleeing the currency and into a "safehaven". This means they are exchanging Pounds for other currencies in order to (1) hold cash in that currency or (2) purchasing a safe(r) asset with that currency (gold, bonds, etc).
The Foreign Exchange Market is a big part of the AP Macroeconomics curriculum. It is one of the harder things to teach and I think one of the more difficult things for students to grasp. After all, it is not something we routinely encounter in daily life BUT it does make its presence known in all facets of our economic lives.
Below I put together some slides illustrating a part of what happened with "BREXIT" in the UK and how students should understand the graphing elements as it pertains to an AP Macro class.
Hope it helps!!!


NOTE: The next slide has a typo. Should be "RECIPROCALS". Thanks.



Friday, April 10, 2015
Part 2---Mini Lesson on the US Dollar vs The Euro.
One year ago (April 9th, 2014) the US dollar price per Euro was $1.40. Read that as it took $1.40 to "buy" 1 Euro dollar. If I wanted to buy something that was priced in Euros, say 100 Euros, I would have had to exchange $140.00US dollars in order to buy it.
Today (April 9th, 2015) the US dollar price per Euro is $1.08. Read that as it takes $1.08 to "buy" 1 Euro--rounded up a bit). If I wanted to buy that same item today and it was still priced at 100 Euros, I would have to exchange $108.00US dollars to make that purchase.
When I exchange my US Dollars to get 100 Euros I give up FEWER US Dollars today than I did one year ago to do so---$32.00 to be exact. The purchasing power of a US Dollar relative to the Euro has INCREASED by 23% ($32.00 divided by $140.00 X 100) in 365 days.
In Macroeconomic terms, we can say the US Dollar has APPRECIATED by 23%.Today I want to look at the same problem but from the standpoint of the Euro.
Currency valuations are simply reciprocals of each other. If you know one, you know the other---with a little math.
The above example read "the US dollar price per Euro was $1.40" one year ago. Expressed as a ratio this would be $1.40/1.00Euro.
If we take the reciprocal of $1.40/1.00Euro we will have 1.00Euro/$1.40. Divide that out and we get "The Euro price of per US Dollar was .71 Euro cents" one year ago.
In other words, last year the holders of Euros had to give up .71 Euro cents in order to "buy" $1.00.
In sum: Holders of dollars had to give up $1.40 to buy 1.00 Euro and conversely the holders of Euros had to give up .71 Euro cents to buy a $1.00.
So, if last year if the holders of Euros wanted to buy something priced at $100.00US they would have had to exchange 71.00 Euros in order to do so (.71 Euro cents X 100).
Move ahead one year.
Yesterday, the US dollar price per Euro was $1.08. If we take the reciprocal of that (1.00 Euro/$1.08) we get the "Euro price per US Dollar was .93 Euro cents.
So, yesterday the holders of Euros would have had to exchange 93 Euros in order to "buy" $100.00. Last year it was 71 Euros. That is a difference of 22 Euros, or in percentage terms, a 31% decrease in value of the Euro relative to the US Dollar (22Euros/71Euros X 100).
In Macroeconomic terms, we can say the Euro has DEPRECIATED by 31%.
Notice while the currencies are reciprocals of each other the percentage changes are not (23% versus 31%). This is because...math. The base numbers are different. One starts at a high base and goes lower and the other a lower base and goes higher. No conspiracy there.
Hopefully you can see from this example that exchange rates matter.
The physical/non-physical properties of the goods or services bought in either the US or Europe are the same (ceterus paribus). The only thing that changes the relative prices of the goods/services is the value of the currencies used to purchase them.
Thursday, April 9, 2015
Mini lesson--US Dollar vs the Euro.
One year ago (April 9th, 2014) the US dollar price per Euro was $1.40. Read that as it took $1.40 to "buy" 1 Euro dollar. If I wanted to buy something that was priced in Euros, say 100 Euros, I would have had to exchange $140.00US dollars in order to buy it.
Today (April 9th, 2015) the US dollar price per Euro is $1.08. Read that as it takes $1.08 to "buy" 1 Euro--rounded up a bit). If I wanted to buy that same item today and it was still priced at 100 Euros, I would have to exchange $108.00US dollars to make that purchase.
When I exchange my US Dollars to get 100 Euros I give up FEWER US Dollars today than I did one year ago to do so---$32.00 to be exact. The purchasing power of a US Dollar relative to the Euro has INCREASED by 23% ($32.00 divided by $140.00 X 100) in 365 days.
In Macroeconomic terms, we can say the US Dollar has APPRECIATED by 23%.
Assuming businesses in the EuroZone did not change their prices over the course of the year, Europe is "On Sale" by 23% today for the holders of US Dollars.
Here is the strange part. If Americans take advantage of this "sale" and go to Europe on vacation, this affects the IMPORTS of goods and/or services to the US from the EuroZone. This is a bit counter-intuitive because we usually think of imports as foreign stuff that is already in the US that we purchase (think Walmart, for example).
Consuming a European good or service, whether here or "there", is considered an import.
Here is your homework. Consider the above example from the perspective of a holder of Euros, using the same exchange rates. Re-write the explanation from that perspective.
Hope this helps you understand a bit more the complex concept that is exchange rates.
Today (April 9th, 2015) the US dollar price per Euro is $1.08. Read that as it takes $1.08 to "buy" 1 Euro--rounded up a bit). If I wanted to buy that same item today and it was still priced at 100 Euros, I would have to exchange $108.00US dollars to make that purchase.
When I exchange my US Dollars to get 100 Euros I give up FEWER US Dollars today than I did one year ago to do so---$32.00 to be exact. The purchasing power of a US Dollar relative to the Euro has INCREASED by 23% ($32.00 divided by $140.00 X 100) in 365 days.
In Macroeconomic terms, we can say the US Dollar has APPRECIATED by 23%.
Assuming businesses in the EuroZone did not change their prices over the course of the year, Europe is "On Sale" by 23% today for the holders of US Dollars.
Here is the strange part. If Americans take advantage of this "sale" and go to Europe on vacation, this affects the IMPORTS of goods and/or services to the US from the EuroZone. This is a bit counter-intuitive because we usually think of imports as foreign stuff that is already in the US that we purchase (think Walmart, for example).
Consuming a European good or service, whether here or "there", is considered an import.
Here is your homework. Consider the above example from the perspective of a holder of Euros, using the same exchange rates. Re-write the explanation from that perspective.
Hope this helps you understand a bit more the complex concept that is exchange rates.
Thursday, October 9, 2014
China vs the US in GDP measurement. I try to explain it using actual vs PPP exchange rates.
China reported its Gross Domestic Product to be 56.88 trillion Yuan in 2013. I am going to assume this is "Nominal GDP", not adjusted for inflation, but I do not know that for certain. I got this from a Chinese newspaper Zinhuanet HERE. On January 1st of 2014 the official exchange rate was 1 Renminbi (Yuan and Renminbi are used interchangeably, sort of) exchanged for $.16529 US cents.
So, putting the GDP in Yuan in dollar terms at the market exchange rate we would take 56.88 Trillion Yuan multiplied by $.16529 and that would equal $9.4 Trillion US dollars.
At the end of 2013 the US Real GDP was $16.768 Trillion dollars (Nominal dollars)
Either way you figure it US GDP is about $7 Trillion more than China's using current (Jan 1, 2014) market exchange rates.
What about many/most economists preferred measure of exchange rates: the Purchasing Power Parity (PPP)?
According to theWorld Bank, the PPP exchange rate (2011 is the latest calculation) is 1 Renminbi exchanges for $.28 US cents.
If we take 56.88 Trillion Yuan and multiply by $.28 US cents, the PPPexchange rate, we get $15.926 Trillion US dollars, about $800 million shy of the US GDP at the end of 2013.
The big picture here suggests the Yuan is UNDERVALUED relative to the US dollar. Instead of the actual market exchange rate where $1.00 US dollar "buys" 6.04 Yuan (or 1 Yuan buys $.16529 US cents) it should buy only 3.57 Yuan ( or 1 Yuan buys $.28 US Cents) based on PPP.
In other words, the dollar should be weaker (depreciate) and the Yuan should be stronger (Appreciate).
But it is not, hence the difference in nominal GDP's based on actual exchange rates as compared to PPP.
I hope that makes some sense. Quite the difficult concept to walk through!
So, putting the GDP in Yuan in dollar terms at the market exchange rate we would take 56.88 Trillion Yuan multiplied by $.16529 and that would equal $9.4 Trillion US dollars.
At the end of 2013 the US Real GDP was $16.768 Trillion dollars (Nominal dollars)
Either way you figure it US GDP is about $7 Trillion more than China's using current (Jan 1, 2014) market exchange rates.
What about many/most economists preferred measure of exchange rates: the Purchasing Power Parity (PPP)?
According to theWorld Bank, the PPP exchange rate (2011 is the latest calculation) is 1 Renminbi exchanges for $.28 US cents.
If we take 56.88 Trillion Yuan and multiply by $.28 US cents, the PPPexchange rate, we get $15.926 Trillion US dollars, about $800 million shy of the US GDP at the end of 2013.
The big picture here suggests the Yuan is UNDERVALUED relative to the US dollar. Instead of the actual market exchange rate where $1.00 US dollar "buys" 6.04 Yuan (or 1 Yuan buys $.16529 US cents) it should buy only 3.57 Yuan ( or 1 Yuan buys $.28 US Cents) based on PPP.
In other words, the dollar should be weaker (depreciate) and the Yuan should be stronger (Appreciate).
But it is not, hence the difference in nominal GDP's based on actual exchange rates as compared to PPP.
I hope that makes some sense. Quite the difficult concept to walk through!
Depreciation and Small businesses in Japan. My example.
Here is a nice article on how swings in currency exchange rates are having an adverse affect on small businesses in Japan. Here is an excerpt and below that I do a simple example to show how this works in "real life". Exchange Rates MATTER!
Data Show More Smaller Companies Succumbing to Weak Yen
"The failed businesses, many of them small, were struck by the higher costs of imported materials such as fuel, minerals and food as the exchange rate shifted from less than ¥80 per dollar two years ago to as high as ¥110 in recent days.(*emphasis mine).
Hit hardest was the transportation industry, including trucking companies, which saw 81 companies go bankrupt. The number of insolvencies totaled 44 in manufacturing, 41 in wholesale and 19 in services, the research company said."Example:
I am a Japanese small business-person. I produce a "widget" that sells for $100 Yen in Tokyo.
Assume half the cost of producing and selling one widget comes from inputs I must import from the US--50 Yen. Prior to the weakening of the Yen against the dollar, one US dollar exchanged for 80 Yen or, inversely, one Yen exchanged for 1.3 US cents.
So, for me to purchase my inputs from the US I took 50 Yen and sold them for 1.3 cents each for a total of 6.5 US cents. Remember, this is half the cost for me to produce and sell the widget. This means the price for my widget, in US currency, is 13 US cents.
Now, the exchange rate moves to one US dollar exchanges for 110 Yen or, inversely, one Yen exchanges for .9 US cents (9/10ths of a cent/penny). The Yen does not "buy" as much US currency as it did before. So I am going to have to give up MORE Yen in order to pay for the 6.5 US cents worth of inputs I need.
How many Yen do I need at the exchange rate of one Yen buys 9/10th of a cent to get 6.5 US cents?
YEN ("X") Times .09 US cents = 6.5 US Cents. Solve for YEN "X" and you get 72.22 Yen.
Through no fault of my own, events beyond my control, my cost of production using US inputs has increased from 50 Yen to 72.22 Yen, a 44% increase.
Assuming I have little pricing power domestically because of competition and cannot raise the price, it is easy to see how small companies in Japan are under pressure. If they cannot cut costs elsewhere to off-set the currency swing, then they risk going out of business.
I hope this simple example helps you understand better how changes in exchanges rates can affect big AND small businesses.
Thursday, September 11, 2014
How to read a "Cross Currency Rate" chart for the lesson on Foreign Exchange Rates.
One way students might encounter an exchange rate chart is in the from of "Cross Currency Rates"
It is in table form and can be tricky to read if you are not careful. I know I have made errors in trying to read one.
I put together a very short presentation that makes it clear. Hope it helps.
It is in table form and can be tricky to read if you are not careful. I know I have made errors in trying to read one.
I put together a very short presentation that makes it clear. Hope it helps.
Wednesday, May 28, 2014
Here is some great info on the high Australian Minimum Wage. This is not to change minds but to add to your knowledge base. Both sides will find some supporting evidence.
When we compare minimum wages across borders it can get dicey because we have to interject currency exchange rates. We can use actual market exchanges rates or we can use the Purchasing Power Parity (PPP) exchange rate. Depending on the currency you are comparing those two rates can be vastly different.
This is the case with the US dollar relative the Australian dollar.
The actual exchange rate (05/28/2014) is $1.00US = $1.0849A or $1.00A = $.92168US (these numbers are reciprocals of each other).
The current Australian minimum wage is $16.37 Australian Dollars (with some important caveats. See below). If we convert that to dollars it would be $15.08 US dollars ($16.37A times $.92168US). NICE!
However, if we use PPP the exchange rate (for 2013 the latest I could find at OECD) would be $1.00US= $1.4728A or $1.00A = $.6789US.
Now, the Australian minimum wage of $16.37A would be $11.12 US. Still better than our $7.25 in the US, BUT not as high as $15.08 using current market exchange rates.
PPP theory suggests that the Australian dollar is OVERVALUED in the market place by as much as 35%. Looking at current data from the OECD, it is more like 42% or so.
I do all this beforehand so I can introduce this chart I found. It is from MyWage Australia.
I modified it a bit to add some info (in black boxes).
In Australia there are some significant exceptions/exemptions from the minimum wage that are RARELY, if at all, discussed along with the issue. I was not aware of them either!
For the different age groups I calculated what the minimum wage was in current market exchange rates and in Purchasing Power Parity.
According to PPP, if you are under 16, 16 or 17 the minimum wage in Australia is significantly lower than in the US. Only after reaching 18 does it improve above the US minimum.
I did not calculate the rates for Apprenticeships, but if you take the number you see there and multiply by $.6789 US you will get the PPP in US dollars.
I hope this gives you more perspective and depth to your knowledge base on this issue.
The next time someone throws out the high US dollar figure when discussing the Australian min wage, you can legitimately ask: "Is that in market exchange rates or at PPP?". Watch the look you get... :)
This is the case with the US dollar relative the Australian dollar.
The actual exchange rate (05/28/2014) is $1.00US = $1.0849A or $1.00A = $.92168US (these numbers are reciprocals of each other).
The current Australian minimum wage is $16.37 Australian Dollars (with some important caveats. See below). If we convert that to dollars it would be $15.08 US dollars ($16.37A times $.92168US). NICE!
However, if we use PPP the exchange rate (for 2013 the latest I could find at OECD) would be $1.00US= $1.4728A or $1.00A = $.6789US.
Now, the Australian minimum wage of $16.37A would be $11.12 US. Still better than our $7.25 in the US, BUT not as high as $15.08 using current market exchange rates.
PPP theory suggests that the Australian dollar is OVERVALUED in the market place by as much as 35%. Looking at current data from the OECD, it is more like 42% or so.
I do all this beforehand so I can introduce this chart I found. It is from MyWage Australia.
I modified it a bit to add some info (in black boxes).
In Australia there are some significant exceptions/exemptions from the minimum wage that are RARELY, if at all, discussed along with the issue. I was not aware of them either!
For the different age groups I calculated what the minimum wage was in current market exchange rates and in Purchasing Power Parity.
According to PPP, if you are under 16, 16 or 17 the minimum wage in Australia is significantly lower than in the US. Only after reaching 18 does it improve above the US minimum.
I did not calculate the rates for Apprenticeships, but if you take the number you see there and multiply by $.6789 US you will get the PPP in US dollars.
 |
| MyWage site from Australia |
The next time someone throws out the high US dollar figure when discussing the Australian min wage, you can legitimately ask: "Is that in market exchange rates or at PPP?". Watch the look you get... :)
Tuesday, May 20, 2014
"Purchasing Power Parity for Dummies"---like me!
Purchasing Power Parity is somewhat of a difficult concept to grasp for the average high school student. Heck, I struggle with it.
I will try to make it as easy as possible with my explanation here. Sort of my personal "Purchasing Power Parity for Dummies".
Let's say we have a shopping list of various goods and services that are available in the US and in the European Union and these goods and/or services are identical in every way. People in the US and the EU buy these items on a regular basis so they are important for daily/weekly/monthly consumption.
We have two baskets. One basket, "Basket 1", is labeled purchased in the USA and the other basket, "Basket 2", is labeled purchased in the European Union. Let's go shopping!
The items in Basket 1 (USA) total $150.00 and are purchased using US dollars. The items in Basket 2 (EU) total 100 Euros and are purchased using Euros.
What if me and my European friend wanted to change places--- I buy my stuff in Europe and he buys his in the US. The first thing I would have to do is exchange my US Dollars into Euros and he would have to exchange his Euros into Dollars. What would be the exchange rate so that we could buy the SAME goods and services as we did before?
Ratios, man, Ratios.
If you divide the value of Basket 2 (100 Euros) by the value of Basket 1 ($150)---100 Euros/$150--- we get an exchange rate .67 Euros cents PER dollar exchanged. Meaning, for every dollar I exchange for Euros I get .67 Euro cents. So in order for me to get the requisite 100 Euros to buy my basket of goods in Europe I will need to exchange $150 US dollars to do so ($150 X .67 Euros = 100 Euros).
The reciprocal is going to be true for my European friend.
If you divide the value of Basket 1 ($150) by the value of Basket 2 (100 Euros)---$150/100 Euros---we get and exchange rate of $1.50 PER Euro exchanged. Meaning, for every Euro my friend exchanges for Dollars, he will get $150. So in order to get the requisite $150 to buy his basket of goods in the US he will need to exchange 100 Euros to do so (100 Euros X $1.50 = $150 US dollars).
Purchasing Power Parity (PPP) is defined as:
The exchange rate I calculated above would be the Purchasing Power Parity Exchange Rate.
Again, that is: $1.00 US = .67 Euros and/or 1.00 Euro = $1.50. At this exchange rate, me and my friend can buy our basket of stuff in each others country and our currency will have the SAME purchasing power regardless if it is in Dollars or Euros.
Purchasing Power Parity is basically a reference point as to where exchanges rate SHOULD BE in the Long Run. For the most part, the ACTUAL exchange rate between to currencies varies from the PPP exchange rate.
Today the exchange rate between the Dollar and the Euro is ACTUALLY:
At today's exchange rate I can get .73 Euro cents per dollar exchanged which is $.06 cents more than PPP suggests. So, for a holder of US dollars that basket of stuff is LESS EXPENSIVE to buy (I get MORE Euro cents than at PPP so the Euro basket costs me less).
For my European friend at today's exchange rate he can get only $1.37 per Euro exchanged which is .13 cents less than PPP suggests. So, for a holder of Euros that basket of stuff is MORE EXPENSIVE to buy (he gets FEWER cents than at PPP so the US basket costs him more).
This suggests, with my example, that the US dollar is OVER-VALUED compared to the Euro and the Euro is UNDER-VALUED compared to the US dollar, relative to the PPP exchange rate.
In the long run, according to PPP theory, the Dollar should depreciate in value and the Euro should appreciate in value so that the currencies used to purchase the stuff in the respective market baskets will have the same purchasing power.
Hope this helps somewhat. Let me know if I went wrong anywhere---remember I am one of the Dummies myself. :)
I will try to make it as easy as possible with my explanation here. Sort of my personal "Purchasing Power Parity for Dummies".
Let's say we have a shopping list of various goods and services that are available in the US and in the European Union and these goods and/or services are identical in every way. People in the US and the EU buy these items on a regular basis so they are important for daily/weekly/monthly consumption.
We have two baskets. One basket, "Basket 1", is labeled purchased in the USA and the other basket, "Basket 2", is labeled purchased in the European Union. Let's go shopping!
The items in Basket 1 (USA) total $150.00 and are purchased using US dollars. The items in Basket 2 (EU) total 100 Euros and are purchased using Euros.
What if me and my European friend wanted to change places--- I buy my stuff in Europe and he buys his in the US. The first thing I would have to do is exchange my US Dollars into Euros and he would have to exchange his Euros into Dollars. What would be the exchange rate so that we could buy the SAME goods and services as we did before?
Ratios, man, Ratios.
If you divide the value of Basket 2 (100 Euros) by the value of Basket 1 ($150)---100 Euros/$150--- we get an exchange rate .67 Euros cents PER dollar exchanged. Meaning, for every dollar I exchange for Euros I get .67 Euro cents. So in order for me to get the requisite 100 Euros to buy my basket of goods in Europe I will need to exchange $150 US dollars to do so ($150 X .67 Euros = 100 Euros).
The reciprocal is going to be true for my European friend.
If you divide the value of Basket 1 ($150) by the value of Basket 2 (100 Euros)---$150/100 Euros---we get and exchange rate of $1.50 PER Euro exchanged. Meaning, for every Euro my friend exchanges for Dollars, he will get $150. So in order to get the requisite $150 to buy his basket of goods in the US he will need to exchange 100 Euros to do so (100 Euros X $1.50 = $150 US dollars).
Purchasing Power Parity (PPP) is defined as:
Purchasing-power parity theory. A theory which states that the exchange rate between one currencyand another is in equilibrium when their domestic purchasing powers at that rate of exchange are equivalent.
In short, what this means is that a bundle of goods should cost the same in Canada and the United States once you take the exchange rate into account.
The exchange rate I calculated above would be the Purchasing Power Parity Exchange Rate.
Again, that is: $1.00 US = .67 Euros and/or 1.00 Euro = $1.50. At this exchange rate, me and my friend can buy our basket of stuff in each others country and our currency will have the SAME purchasing power regardless if it is in Dollars or Euros.
Purchasing Power Parity is basically a reference point as to where exchanges rate SHOULD BE in the Long Run. For the most part, the ACTUAL exchange rate between to currencies varies from the PPP exchange rate.
Today the exchange rate between the Dollar and the Euro is ACTUALLY:
$1.00 = .73 Euro cents and 1.00 Euro = $1.37
Compared to the PPP exchange Rate we calculated above:
$1.00 =.67 Euros cents and 1.00 Euro = $1.50
At today's exchange rate I can get .73 Euro cents per dollar exchanged which is $.06 cents more than PPP suggests. So, for a holder of US dollars that basket of stuff is LESS EXPENSIVE to buy (I get MORE Euro cents than at PPP so the Euro basket costs me less).
For my European friend at today's exchange rate he can get only $1.37 per Euro exchanged which is .13 cents less than PPP suggests. So, for a holder of Euros that basket of stuff is MORE EXPENSIVE to buy (he gets FEWER cents than at PPP so the US basket costs him more).
This suggests, with my example, that the US dollar is OVER-VALUED compared to the Euro and the Euro is UNDER-VALUED compared to the US dollar, relative to the PPP exchange rate.
In the long run, according to PPP theory, the Dollar should depreciate in value and the Euro should appreciate in value so that the currencies used to purchase the stuff in the respective market baskets will have the same purchasing power.
Hope this helps somewhat. Let me know if I went wrong anywhere---remember I am one of the Dummies myself. :)
Monday, May 19, 2014
The Swiss proposed a minimum wage of $25 per hour...or is it $16? Depends on your definition of exchange rate
The Swiss held a nationwide vote to raise the minimum wage and it was soundly defeated. In the US, the media reported that it would have been about $25.00 US Dollars had it passed. Seems like a lot! But is it REALLY that much? It depends on what your definition of "exchange rate is".
For the Swiss the number they saw on their ballot was "22 Francs per hour".
The current official exchange rate(05/19/2104) is $1.00 US will exchange for .89 Swiss Francs and 1.00 Swiss Franc will exchange for $1.12. The exchange rates are reciprocals of each other.
So, if we take 22 SF and multiply by $1.12 that equals $24.64. Close enough for the mainstream media to round up to $25.00.
However, economists are hesitant to use current exchange rates because they are so volatile and can change for transient reasons on short notice. These fluctuations can distort the real economic picture within a domestic economy. They prefer to use an exchange rate based on "Purchasing Power Parity" (PPP).
PPP compares the actual price of a market basket of identical goods/services in Switzerland and the US. The idea is to establish a more realistic exchange rate that shows the purchasing power of one currency relative to other in terms of what it can buy in either country.
Purchasing Power Parity (PPP): $1.00 US will exchange for 1.37 Swiss Francs and 1 Swiss Franc will exchange for $.73 in 2013 according to official OECD data for 2013.
At this exchange rate, 22 Swiss Francs at $.73 equals $16.06. (Many media outlets are reporting it as about $14.00 PPP---I do not know how they arrive at that number) I WELCOME ANY HELP ON MY MATH!!
So, at the market exchange rate the Swiss minimum wage would be $24.64 but at the PPP exchange rate it would be a $16.06.
That is still a very high minimum wage at $16.00 per hour, but I think it is important to put it in its proper purchasing power context. Hope it helps...
REVISION: There are 3 sets of PPP numbers available on the OECD website HERE. You can see the categories on the LEFT side of page. I used "PPP and Exchange Rates" to do the above calculation. However, if you click on either of the other two links (PPP for Private Consumption or PPP for individual consumption) you will find HIGHER PPP numbers for Switzerland. Using these numbers you get closer to $14.00 in US dollars.
For the Swiss the number they saw on their ballot was "22 Francs per hour".
The current official exchange rate(05/19/2104) is $1.00 US will exchange for .89 Swiss Francs and 1.00 Swiss Franc will exchange for $1.12. The exchange rates are reciprocals of each other.
So, if we take 22 SF and multiply by $1.12 that equals $24.64. Close enough for the mainstream media to round up to $25.00.
However, economists are hesitant to use current exchange rates because they are so volatile and can change for transient reasons on short notice. These fluctuations can distort the real economic picture within a domestic economy. They prefer to use an exchange rate based on "Purchasing Power Parity" (PPP).
PPP compares the actual price of a market basket of identical goods/services in Switzerland and the US. The idea is to establish a more realistic exchange rate that shows the purchasing power of one currency relative to other in terms of what it can buy in either country.
Purchasing Power Parity (PPP): $1.00 US will exchange for 1.37 Swiss Francs and 1 Swiss Franc will exchange for $.73 in 2013 according to official OECD data for 2013.
At this exchange rate, 22 Swiss Francs at $.73 equals $16.06. (Many media outlets are reporting it as about $14.00 PPP---I do not know how they arrive at that number) I WELCOME ANY HELP ON MY MATH!!
So, at the market exchange rate the Swiss minimum wage would be $24.64 but at the PPP exchange rate it would be a $16.06.
That is still a very high minimum wage at $16.00 per hour, but I think it is important to put it in its proper purchasing power context. Hope it helps...
REVISION: There are 3 sets of PPP numbers available on the OECD website HERE. You can see the categories on the LEFT side of page. I used "PPP and Exchange Rates" to do the above calculation. However, if you click on either of the other two links (PPP for Private Consumption or PPP for individual consumption) you will find HIGHER PPP numbers for Switzerland. Using these numbers you get closer to $14.00 in US dollars.
Subscribe to:
Posts (Atom)
 View My Stats