Showing posts with label AP Micro. Show all posts

Wednesday, August 17, 2016

Market for Irish Cattle---Change in Quantity Supplied vs Change in Supply

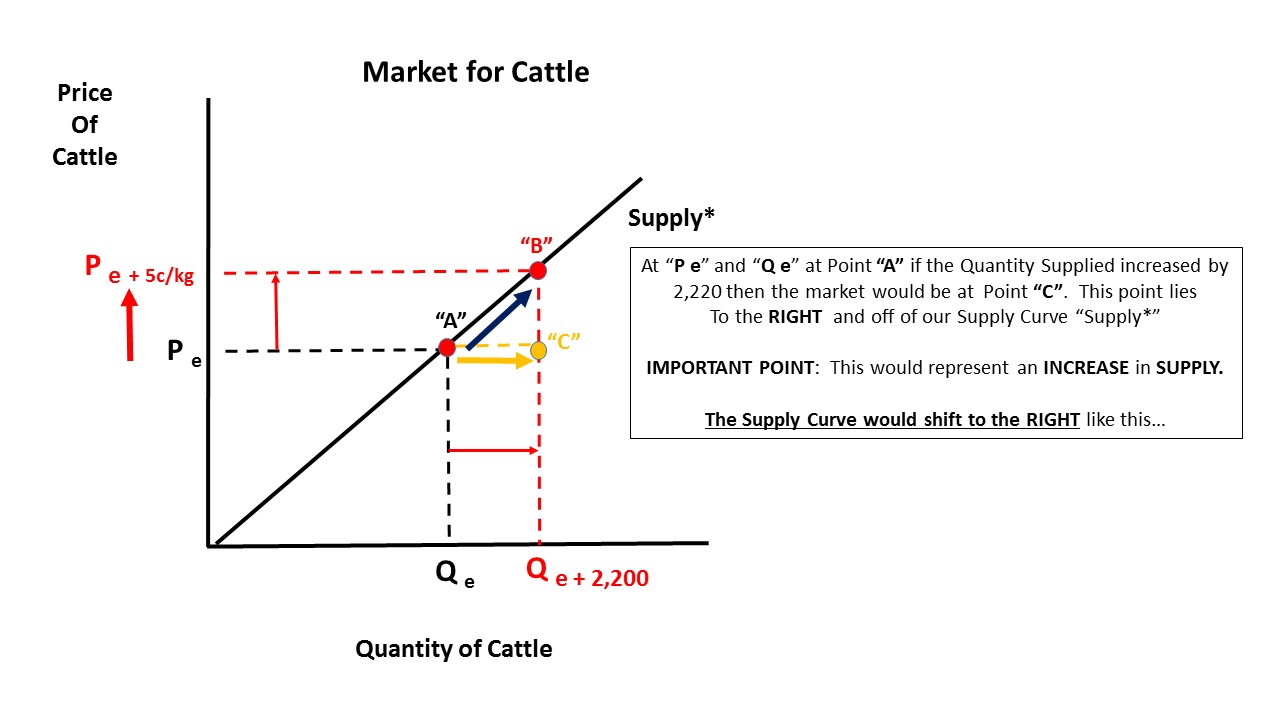
One of the most frustrating things to teach AND learn in a basic microeconomics class is the difference between a change in Quantity Demanded and/or Supply and a change in Demand and/or Supply---whether we move along the respectived curve or the curve shifts entirely in one direction or the other.

This very short article from a website that reports on agricultural issues in Ireland provides a nice example on the supply side to illustrate the difference:
The number of prime cattle slaughtered at Department of Agriculture approved beef export plants has jumped 10% in the space of a week. 
Figures from the Department show that the throughput of young bulls, steers and heifers increased by just over 2,200 head last week compared to the week before. 
Towards the end of last week and into this week, factory buyers were willing to pay an extra 5c/kg on top of the base price in order to secure stock.And this move appears to have worked, as an additional 2,285 cattle were presented for slaughter during the week ending August 14.
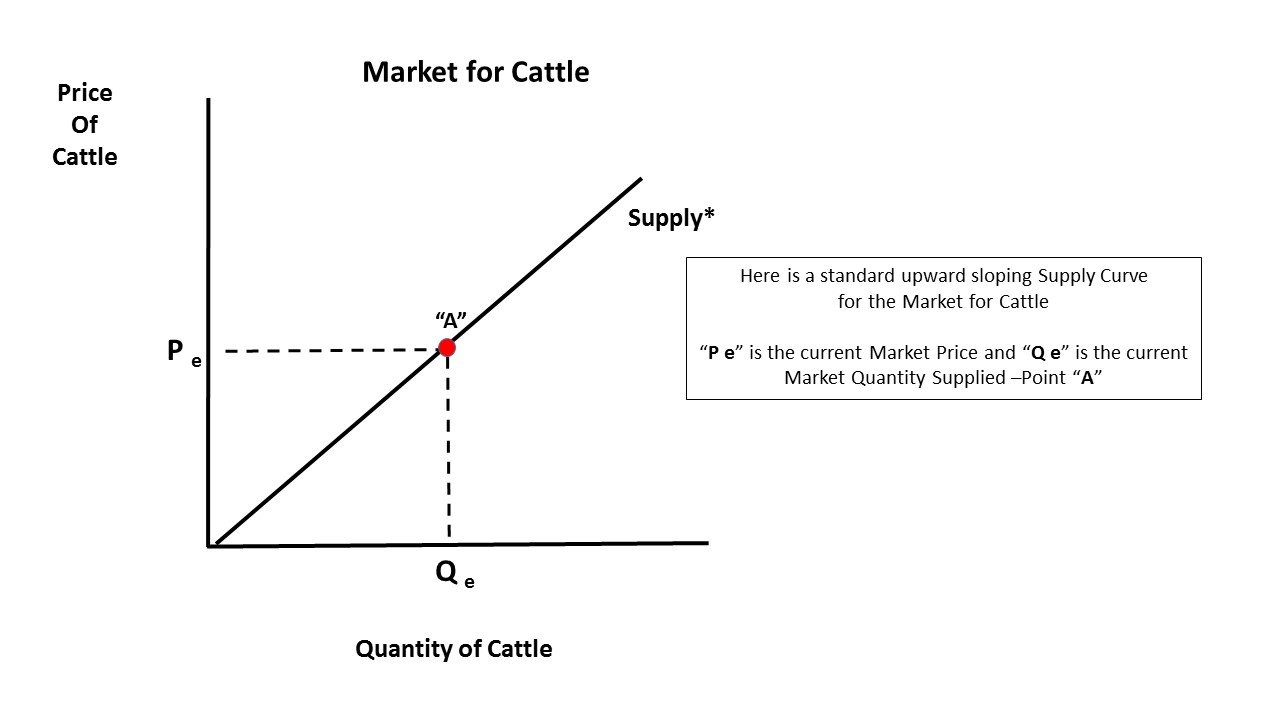
Here are some slides that will help explain the difference. Hope it helps!


Thursday, August 21, 2014

Economic vs Accounting Profit: Corn or Soybean? That is the question--answered here.

Using data from the US Dept of Agriculture Economic Research Service (USDA-ERS) I made the following two charts (I am in the infant stages of learning Excel, excuse the poor formatting!).

They show the "Accounting Profit"(RED) and "Economic Profit" (BLUE) for Corn and Soybeans in 2013. The distinction between the two is important in AP Microeconomics.

When tallying costs, accountants only care about explicit money costs paid for resources.  When calculating economic costs, economists include implicit Opportunity Costs in addition to money costs.

Economic costs are ALWAYS going to be more than accounting costs, hence economic profits are ALWAYS going to be less than accounting profits. Repeat that until it clicks!

As a recent transplant to the mid-West (Illinois, now Ohio) I have quickly learned that Corn and Soybean require very similar resources to grow---the Opportunity Cost of switching from one to the other is apparently quite low.

Simple observation:  Growing Corn in the "Northern Great Plains" does not seem like a good idea. Soybean returns a higher accounting and economic profit.  Growing Soybean in the "Heartland" seems like a GREAT idea--accounting AND economic profits are high.

Note this data are for 2013.  I drive around Central Ohio quite a bit.  I notice many more fields that had corn last year are now teeming with soybean. Why?

Economic theory (and apparently practice if I can believe my lying eyes!) suggests in a "perfectly competitive" market, the presence of economic profit(s) induces producers to enter that market.

Use these graphs as you wish.  Hope it helps with the concept.


Here are the agricultural regions (SOURCE USDA-ERS):


Saturday, August 16, 2014

Back to the Future: Russia threatens price controls in the face of Economic Sanctions. We know how this will work out.

Predictable consequences are playing out in the economic sanctions world---with more to come:.

Russians already hurt by Western food import ban

Russians are already paying a price — literally — for the ban on food imports from Europe and the United States that Russia imposed last week to retaliate for American and European economic sanctions.
Suppliers and consumers are facing shortages and price hikes on staples such as fish and fruit, as well as gourmet items such as Italian Parmesan and French Brie cheese.
Suppliers have raised prices for some fish by 20-36%, one of Russia's biggest retailers, X5 Retail Group, complained to Russia's government, the Kommersantbusiness daily reported on Wednesday. Suppliers reported shortages and higher prices for fruit, retailers braced for milk prices to go up, and some meat suppliers were engaging in price speculation, Kommersant reported.
Russia's Central Bank warned last week that the sanctions are likely to increase an already rising inflation rate. Even so, Russia's government has pledged that prices will not go up as a result of the import ban, promising that the Federal Anti-Monopoly Service will check reports of suppliers raising prices.
In the worst case, the government could resort to price controls, Kommersantreported.
Should Russia enforce price controls one unintended BUT predictable consequence would be the rise of Black Market activity.  Russians are used to this--they just need to brush off the rust from the old Communist days.

Below I explain the economic theory/rationale behind the rise of Black Market activity in face of Government policy to control prices.  Let me know what you think. Thanks.


Tuesday, August 12, 2014

Shark Week and the Market for Shark Tacos. Let's go to the graphs.

Shark Week on T.V. has appartently increased the demand for Shark Meat in a variety of forms.

NPR has a story on this:
Discovery Channel set viewership records in 2013 as millions of people tuned in to watch sharks feed, sharks attack, extinct giant sharks and researchers catch and tag sharks. Discovery's "Shark Week" returned on Sunday, and this year, to the dismay of conservationists, restaurants and markets nationwide are feeding the frenzy with a slew of shark meat promotions.
This gives me an opportuntity to "go to the graphs" and analyze this development from a basic supply and demand perspective as to what SHOULD happen using the "Market for Shark (Meat) Tacos".

I think I have this right, but let me know where I might have gone wrong. If you can use this in your class(es) feel free to do so. There is no tragedy in this common(s).  :)

It is time for lunch where I am but I am pretty sure a Shark Taco is not on the menu for me. Yuck!


Friday, July 25, 2014

Something's fishy in Alaska in the canned salmon market. Let's go to the graphs.

Another day, another easy pickin' economics lesson pulled from the headlines.

"Alaska Governor asks the Federal Government to buy Surplus Canned Salmon"

Gov. Sean Parnell has asked a federal agency to buy about 1 million cases of canned pink salmon to ease a glut that has weighed down prices for Alaska fishermen this year. 
Parnell made the request in a letter to U.S. Agriculture Secretary Tom Vilsack this week. He wants the USDA to purchase $37 million worth of canned pink salmon under a federal law that allows for buying surplus food from farmers and donating it to food banks or other programs. 
USDA purchased $20 million worth of salmon earlier this year, which Parnell called an important first step in reducing inventories to help slow a price decline that he said threatened the 2014 fishing season. 
He said remaining unsold inventories are driving prices to levels that threaten harvest activity this year and next, with the price of canned pink salmon 23 percent lower than a year ago and the advance price paid to fishermen down about 33 percent.
By purchasing the surplus canned salmon from Alaskan fish processors, the Governor is essentially asking for a de facto PRICE FLOOR be imposed on the market for Canned Salmon.

The thinking is this: Buy the surplus so the processors (1) don't have to unload it at lower prices (this is not mentioned in the article) and (2) the price the processors pay fisherman for their catch for the upcoming season will not decrease.  Easy, right?

Let's go to the graphs to see how this plays out.  Hope it helps you in understanding your lesson on this topic.


Friday, June 13, 2014

Corn, Wheat and Soybeans OH MY! I calculate "Economic Profit" for each. See which one gets planted.

In my last posting (HERE) I used USDA cost and crop yield data to show the different costs per bushel a farmer faces when choosing to produce Corn, Soybean or Wheat.  I balanced that against the Price Floor for each crop as established by the 2014 Farm Bill ("PLC or "Price Loss Coverage" provision) to show that the price floor amounts were enough to cover all the farmers Variable Costs but only some of the Fixed Costs. Please re-read that post for more clarification.

In this posting, I want to compare the two different cost numbers I calculated to the current market price for the respective commodity.  I used the table below from the USDA to show costs per acre for each crop.


The USDA projects yields for each of these crops to be (in 2013-14):

   Corn: 165 bushels per acre.
   Soybean: 43 bushels per acre.
   Wheat: 47 bushels per acre.

If we divide these projected bushels per acre into the "TOTAL ALLOCATED COSTS " (Variable PLUS Fixed and Opportunity Costs) for each commodity we will arrive at a "Cost per Bushel" for growing each of these crops:

    Corn: $4.18
    Soybean: 11.10
    Wheat: $6.78

If we divide the projected bushels per acre into just the "TOTAL OPERATING COSTS", or ONLY the Variable Costs then the cost per bushel would be:

Corn: $2.19
Soybean: $4.27
Wheat: $2.77

Here are the current market prices (per bushel) for these crops according to Agriculture.com:


The prices are highlighted in YELLOW and you should read them as follows:

Corn: $4.47 
Soybeans: $12.21 
Wheat: $5.86 

If we subtract "TOTAL ALLOCATED COSTS" from the market prices we find:

Corn yields an "Economic Profit" of $.29 per bushel
Soybean yields an "Economic Profit"of $1.11 per bushel
Wheat yields an "Economic LOSS" of $.92 per bushel

Result?

This year (2014) the projected plantings for:

     Wheat down 347,000 acres
     Corn down 3,674,000 acres
     Soybean UP 4,960,000 acres (yes, that is almost 5 million acres)

At $1.11 per bushel in potential "economic profit" the market has reallocated agricultural resources suitable to produce corn, wheat or soybean to its highest (or higher) value commodity.

As always, constructive comments on methodology are welcome.

Friday, May 30, 2014

I found a Microeconomics Unicorn! See the chart here.

A rare treat for an economics teacher.  A chart that quantifies (not completely but enough) the difference between "Economic Costs" which include opportunity costs (implicit costs) as well as money costs (explicit costs), and "Accounting Costs" which include ONLY money costs. 

Source: USDA ERS

Costs of production for U.S. milk decline as the size of the dairy operation (measured by the number of cows) increases.  Based on 2013 data, average total economic costs of milk production—a measure that includes the opportunity costs of land, labor, and other owned resources—fell by nearly 60 percent, from an average of about $50 per hundredweight (cwt) for producers with fewer than 50 cows to about $20 per cwt for those with 1,000 cows or more. Average costs are lower on larger farms because fixed cost items, such as management, land, and other resource costs, are spread across a larger number of cows, and because average output per cow increases along with farm size. Mean output per cow was just over 15,000 pounds among operations with less than 50 cows, while operations with 1,000 or more head averaged more than 23,000 pounds per cow. Higher milk yields on larger farms stem from factors such as better breeding, nutrition, and health management, as well as the ability to access competitively priced supplies of high quality feed inputs.  This chart is based on data found in Milk Cost of Production Estimates.
 

This is a key concept in AP Microeconomics that is somewhat difficult to convey to high school aged students.

The vertical difference between the RED and BLUE lines represents the Opportunity Costs to the producer for staying in business.

The price or Marginal Revenue (MR) or Average Revenue (AR), a producer receives must at least equal the RED line for her to "Break Even".  

However, she could still make an Accounting Profit at that price.  Is she?

According to the USDA ERS (HERE) the average price for "all classes of milk" was $20.05 per CWT) in 2013.  Now look back at the graph and draw a straight line across the $20.00 mark denoted on the vertical axis.  Compare that to the RED and BLUE lines.

At that price ONLY the large producers (1000 or more milk cows) are Breaking Even in "Economic" terms BUT making profit in "Accounting" terms.

Notice at about 300 cows the average costs start to drop at a relatively steep rate and production increases quickly.  I assume that is the inflection point where economies of scale really kick in.

Hope this helps with teaching and/or learning about this important concept when the topic of a firm that operates in a "Perfectly Competitive" market.

Thursday, April 17, 2014

Sriracha Sauces loss is my gain. Nice example to show how a potential change in fixed costs and variable costs affect a firm.

Sriracha sauce maker considers relocation

The makers of the most popular Sriracha sauce (Huy Fong Foods) is facing a dilemma.  A by-product of producing the sauce is an awful smell that permeates the air in the City of Irwindale, California where the manufacturing facility is located.  Area residents don't like it and want something done about it.

The city wants the company to install air-scrubbing technology.  Apparently this is very expensive to do and the company is resisting.

I suppose if the company refuses it can be fined, better yet for our analysis, a "per unit tax" could be levied on each bottle produced.

So, the firm faces the possibility of having to incur a large up front "fixed cost" of installing the equipment or face a small-ish "per unit tax" variable cost on each of the bottles it produces.

Which is better for the firm?

Let's see how this affects the firm in context of how we study it in AP Microeconomics.

I presume Hoy Fung Foods in one of several competitors in the market for Hot Sauce.  As such, I will classify it as operating as a "Monopolistic Competitor".

Here is what the firm graph would look like assuming Hoy Fung Foods is making "Economic Profits" and operating as it has been.


Installing the equipment would be a "fixed cost" for the company.  It is a cost that is incurred regardless of how many bottles of the hot sauce are produced and the cost is spread out over an all the additional bottles produced.  

This affects the AVERAGE TOTAL COST ("ATC*) of producing ONLY and NOT the Marginal Cost ("MC*) of producing each bottle.

This will SHIFT the ATC curve "ATC*" UP to "ATC 1".  The profit maximizing quantity at MR=MC stays the same  at Point "A" (read that again!).   What does change is the firms Economic Profit. 

Where I shifted the "ATC 1" curve, it assumes that it is at "Break Even" (in Economic terms, not Accounting terms) at Point "B".

So, Hoy Fung Foods is breaking even and still producing the same amount of product at Qe and at the same Price consumers are willing and able to pay at "Pe".  Status quo, except for profits!!


What if instead a per unit tax is assessed on each bottle of hot sauce. That would be a small dollar amount for Hoy Fung to absorb, so it MUST be better....right?

A per unit tax affects BOTH the ATC and the Marginal Cost (MC) of producing.  The tax applies to each unit and increases the cost of producing each unit by the amount of the tax. This will shift the ATC curve and the MC curve together.  The MC curve will shift to the LEFT to "MC 1"(or some say "up").

It is kinda hard to see with all the curves, but notice our "Profit Maximizing Quantity" at MR = MC is now at a different spot---Point "A" at "Q1".  Because MC shifted it will intersect Marginal Revenue (MR) at a different spot along the MR curve.  THIS IS KEY!!


Let me clean up the graph above for you.  See below. As a result you can see that the PRICE consumers pay is higher than it was ("P1") and the quantity sold is less too.

BUT is gets worse for the firm.  Notice now that the ATC of producing Q1 bottles of hot sauce is now GREATER than the Price received from consumers (ATC 1 more than P1).  The firm is now incurring Economic LOSSES equal to the area "P1-"C"-"D"- P1".


In this simple analysis holding LOTS of variables constant, we can see that Hoy Fung Foods should probably install the equipment to avoid a per unit tax.  It appears it will be the best outcome for the firm.

While this example might not completely reflect the real time situation, I hope it helps you understand the different way a fixed cost and a variable cost (per unit tax) affects a firm.

This is a must-know concept for the AP Micro test!!


View My Stats