Showing posts with label PPF. Show all posts

Monday, May 26, 2014

Increasing Opportunity Costs and the Farm Bill. Come visit my "Farm" to see what it is about.


Here is a very basic presentation to illustrate the concept of "Increasing Opportunity Costs".  This can be a difficult concept for the average high school student to intuitively understand (at least from my experience it is).

What prompted me to create this was an article I read recently (and cannot find now) about an "unintended consequence" of a Farm Bill provision regarding the subsidies paid to corn growers.

The subsidy was paid on a "per acre planted" basis with no regard as to HOW MUCH corn was harvested on that acre.

The article quoted a farmer as saying this policy encouraged the planting of corn on land "not necessarily suitable" for the growing of corn.  It took multiple acres planted to yield the same amount of corn from land that was more suitable for growing corn.

So, land that might have been more suitable (and efficient) for growing something else (potatoes? rice? grazing?) was put into use for growing corn instead.

Economists would say this policy leads to a less than optimal and inefficient allocation of societal resources.

Politicians would say this policy leads to an optimal allocation of special interest satisfaction.

Guess which of the two is in charge of things.


Monday, May 5, 2014

PPF illustration with maps of Corn and Soybean acreage. Nice real life example.

In the first week of an introductory Economics students encounter the Production Possibilities Frontier (PPF) as the first formal model used in both Micro and Macroeconomics.

The PPF illustrates the productive capacity of an economy if it were fully-employing all of its useful resources (Land, Labor, Capital, Entrepreneurship). The model is flexible and can be used in a Macro sense comparing the production of the broad categories of Capital and Consumer Goods or in a Micro sense comparing the production of two specific goods such as Corn and Soybeans.

If the economy is producing ON (does not matter where) the PPF it is achieving "Productive Efficiency". This means it is fully utilizing its productive resources in the the most efficient and lowest cost way.

WHERE on the PPF, or the particular bundle of the two goods, the economy produces is called "Allocative Efficiency".  That bundle a society produces and consumes is determined by the economic system (market vs socialist vs command) or some combination thereof.  In the US, the price mechanism and/or government policy determines the Allocatively Efficient bundle of goods in the market place.

Nowhere is this more evident than in Agriculture.

Let's look at the two-good model---Corn and Soybeans.

Both require roughly the same climate, terrain and soil to grow.  The Opportunity Cost of switching from growing one to the other is minimal--an acre of land for growing corn will produce a maximum yield in either corn or soybeans.

So, our PFF for Corn and Soybeans, shown below, illustrating the trade-off between growing one or the other would be a straight line representing "constant opportunity costs".  Assume our initial equilibrium point in the year 2001 was at combination of Corn and Soybean planted and harvested acreage---Point "A".


However, in the mid-2000's due to a policy change we had a relatively massive "Allocative Efficiency" change and a re-allocation of land resource from the production of Soybeans to Corn--Point "A" to Point "B".  How do I know this?

See the map below.  The RED areas on the map on the left show the DECREASE in acreage planted for Soybeans and the BLUE areas on the right map show the INCREASE in acreage planted to Corn.

Matches up pretty well, wouldn't you say?

Source:  From USDA Atlas Maps

What was the major the policy change that prompted this reallocation?  I will just leave you with a picture to ponder that one...


Saturday, June 15, 2013

The Corn Belt is expanding at the expense of Wheat. If you are a teacher or student of economics you will be interested in my analysis of how this affects the PPF for Corn and Wheat...

Here is a nice example of how changing conditions ("exogenous variables") alter opportunity costs as they are illustrated on a Production Possibilities Frontier.  Read this excerpt and my discussion continues below.

U.S. Corn Belt Expands to North

Warmer Climate, Hardier Seeds Help Crop Gain on Wheat, North Dakota's Staple

"...Wheat has long dominated the windswept farm fields of the northern Great Plains. But increasingly, farmers here are switching to corn, reflecting how climate change, advancements in biotechnology and high corn prices are pushing the nation's Corn Belt northward.
The shift, which is occurring in northern Minnesota and Canada's Manitoba province as well, shows how warming temperatures and hardier seeds are enabling farmers to grow corn in areas once deemed inhospitable to the crop. As a result, North Dakota's farmers, who produced 4% of last year's U.S. corn crop and are benefiting from high prices for other crops, are invigorating the state's agricultural economy at the same time its energy sector is thriving...."
The general assumption in the PPF model is resources used for one purpose are not easily adaptable or convertible to alternative uses. Some land is more suited for wheat production and if a farmer tries to use some of that land for corn production instead, then it will be increasingly costly to do so in terms of the amount of wheat that land could have produced.

Example:  If I grow wheat on acreage more suited for wheat production and then try to grow some corn instead it might take 4 acres I used to grow wheat to get 1 acre equivalent yield in corn.  In other words, to get 1 acre yield in corn I gave up 4 acres yield in wheat.  That is pretty costly.

The highlighted and underlined portion of the above excerpt suggests that the listed factors have served to reduce the opportunity costs for planting more corn by making wheat resources MORE adaptable to the alternative use of producing corn.

Hey, look, I made some graphs to show this!!

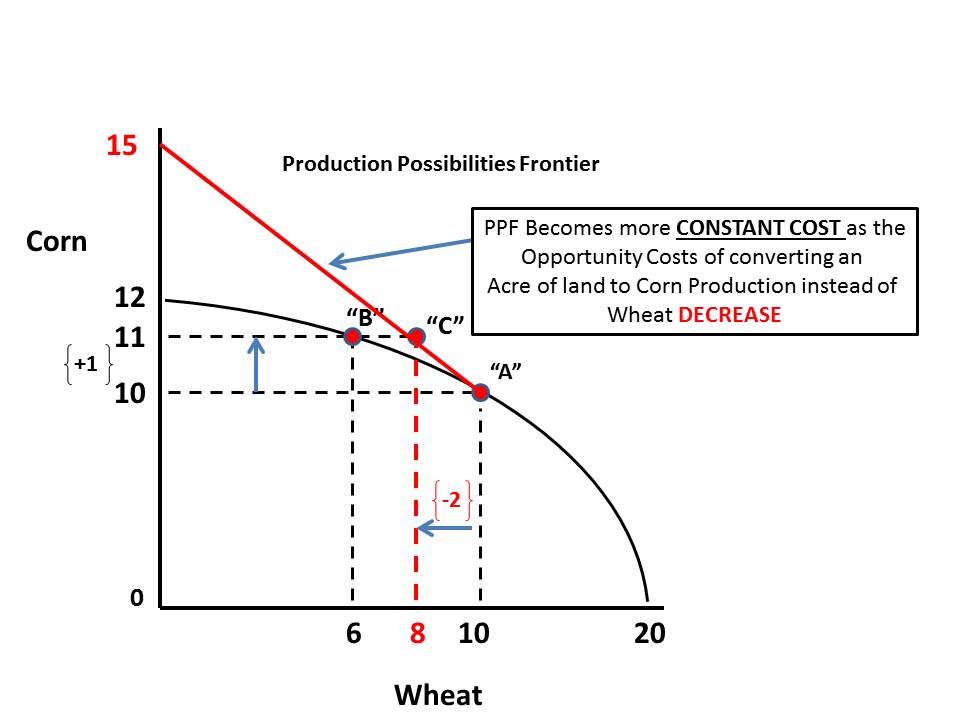
Currently this farmer is producing a bundle of corn and wheat at Point "A".
 Assume she wants to produce another acre worth of corn.  According to the PPF if she does this it is going to cost her 4 acres worth of wheat. We are at Point "B" now.
 Lets assume that the factors listed in the article reduce the opportunity costs of producing corn to just 2 acres worth of wheat. So instead of moving to Point "B" she moves to Point "C" on her PPF.
 The way I read this now is the PPF above Point "A" is going to be less "bowed" (indicating ever increasing opportunity costs as you move along it) and more "constant".
There will be MORE potential yield of corn per acre of wheat given up than there was before.  So, now every time the farmer gives up 2 acres of wheat production, the yield in corn will be greater than before. (I use 15 as an outlier). As the farmer moves along the Red section of the PPF they still give up bushels of wheat to get more corn but it is less costly than before ("ceteris paribus").
Note: Not built to scale so the numbers on the vertical and horizontal axis are not perfect.  Also, keep in mind the numbers reference potential yield in bushels of wheat and corn per acre.  I am not suggesting corn acreage is increasing from 12 to 15.

Saturday, March 31, 2012

Nice article illustrating Opportunity Costs, the PPF and Supply and Demand in Agricultural Markets...

Farmers’ corn push to hit soyabeans (The Financial Times)

Food commodity prices rose after US farmers signalled plans to sow the most corn in 75 years, taking away land from soyabeans, which are facing a fall in supplies due to droughts in South America.
A US government survey of 84,500 farm operators indicated they would plant 95.9m acres (38.4m hectares) with corn this spring, 4 per cent more than last year, the most since 1937 and above expectations. Plantings of soyabeans, often rotated with corn, would fall 1 per cent from last year to 73.9m acres (29.6m hectares), with declines in such fertile states as Iowa, Missouri and Nebraska.

The US is the world’s leading exporter of corn and vies with Brazil in soyabean exports, so decisions made there are vital to global food markets. A growing world population and rising incomes in emerging economies have driven greater appetites for the crops, used in products from pig feed to vegetable oil.

Oilseed traders are increasingly on edge after a severe drought hurt the current soyabean crop in South America. The US Department of Agriculture’s annual Prospective Plantings report sent related canola and rapeseed futures markets higher in Canada and Europe. China buys three of every five bushels of the world’s soyabean imports.

“This is the annus horribilis for South American grain production. La NiƱa hit all the wrong places. For soyabeans, it makes the US all the more important,” said Nick Higgins, commodity analyst at Rabobank, the Dutch bank that is one of the biggest lenders to the agribusiness industry.

The US also said stocks of domestic corn left over from last year’s harvest totalled 6bn bushels on March 1, down 8 per cent from a year ago. The number was slightly lower than anticipated and suggested very low inventories before this year’s harvest begins.

CBOT May corn, which reflects the old crop, rose 6.6 per cent to $6.44 a bushel in Chicago. December corn gained just 3.1 per cent.

CBOT May soyabeans added 3.5 per cent to reach $14.03 a bushel, while soyabeans for November delivery rose 4.1 per cent. ICE May canola rose 3.2 per cent to C$622.50 a tonne in Winnipeg, touching the highest price since the global food crisis of 2007-08.

Corn peaked at a record of almost $8 a bushel last June as growers sought to meet demand from livestock producers and the US ethanol industry. If farmers follow through with planting intentions and yields are good, this year’s crop could break records, helping ease concerns about food prices.
The USDA also said that farmers intended to plant 13.2m acres of cotton, 11 per cent below last year.
Wheat acres are growing 3 per cent from a year ago to 55.9m acres.

Sunday, January 1, 2012

I have planted many a golf ball in a corn field but have not planted much corn on a golf course. See here WHY Iowa farmers are doing just that. How do you say "FORE!" in corn lingo??

A nice article in the NYTIMES today about farmers in Iowa  using every bit of land they can to grow crops, even land that previously had been deemed not worthy of cultivation.  This is an excellent example of increasing opportunity costs as it related to the Production Possibilities Frontier:

"Across much of the Midwest the sharp increase in farm earnings has driven the price of farmland to previously unimaginable — and, some say, unsustainable — levels. But in the process, to much less fanfare, the financial rewards have also encouraged farmers to put ever more land into production, including parcels that until recently were too small or too poor in quality to warrant a second glance."     
Most of the land they currently grow crops on could be labeled "low hanging fruit" which means that relatively little, other than the basics to cultivate, plant, maintain, has to be done to harvest the crop.  It is the most suitable land for growing crops.  However, this fertile land is not unlimited and "at the margins" of the acreage land is going to become less suitable, hence more expensive to convert to growing crops. 

The "opportunity cost" (explicit and implicit costs) of converting this land to grow food is too high relative to (1) the price they might receive for any food grown on it, or (2) an alternative use this land might have may be more suitable for the production of some other good:

A splash of green on a solid beige horizon, the golf course at the edge of this tiny town promised residents nine modest holes of refuge from corn country. Decades earlier the spot had been farmed, too, but the rocky soil was so poor, the saying went, that you couldn’t raise hell there with a fifth of whiskey.         
“The rottenest piece of land there is,” said Mick Elbert, a local car dealer who served on the golf association board. “All it is good for is a golf course. That’s why we built it there.” As Crop Prices Soar, Iowa Farms Add Acreage
Now that there appears to be sustained higher prices for various agricultural commodities, farmers and the communities they live in,  are willing and able to spend additional money and resources (equipment, time, etc) to cultivate this less suitable land because the opportunity cost of NOT doing so (foregone profit for farming relative to the profit, or lack there of, for the golf course) is now greater. 

""But this year, over a chorus of objections, the greens and fairways were plowed under. The course had been losing money, and crop prices had been breaking records, so the new owner did the type of quick calculation that is quietly reshaping the region and determined that it was more valuable as farmland. The first harvest took place this fall..."
For extra credit, draw a Production Possibilities Frontier showing the production of only two goods, Food and Golf Courses.  Show on the graph the result of the landowners decision about what to do with his land ("resource").  Explain why you drew your PPF curve the way you did (straight line or bowed). 


Read the whole article below the fold:


Monday, July 25, 2011

Creative use of Production Possibilities Frontier in regards to heathcare outcomes vs cost between the US and Canada. Regardless of how you feel about the issue, this is informative...

I hesitate to call this a Production Possibilities Frontier (the authors of this study do) because it looks different than the one we use in introductory economics. Appears to me to be somewhat of a supply curve with the output ("Health") on the vertical axis and the inputs ("Resources"--which have a price/cost) on the horizontal axis. But they are smarter than me, so lets go with it. It is a nice illustration of Allocative and Productive Efficiency as applied to health care.
Source: David M. Cutler and Dan P. Ly write of  "The (Paper)Work of Medicine: Understanding International Medical Costs." 
The curve is upward sloping indicating that as we add resources (move to the right from the origin on the horizontal axis) we get positive health outcomes (move up from the origin on the vertical axis). The curve is steep at first, indicating that as more resources are added the returns to health outcomes increase faster relative to the added inputs---Increasing Marginal Returns(see definition). It then flattens out, indicating that as more resources are added the returns to health outcomes start to decrease---Decreasing Marginal Returns (see definition).

There are 3 points identified on the graph "Canada", "Ideal US" and "Actual US". The horizontal difference between "Canada" and "Actual US" is labeled "Allocative (in)Efficiency". This means that to get the SAME health outcomes (point of Vertical axis) as Canada, the US uses more resources to do so---identified with the brackets and labeled "Allocative (in) Efficiency". Resources have a dollar cost, hence to get the same health outcomes as Canada we spend more total dollars.  Allocative Efficiency is achieved when the value consumers place on a good or service (reflected in the price they are willing to pay) equals the cost of the resources used up in production. Condition required is that price = marginal cost. When this condition is satisfied, total economic welfare is maximised."".  All things equal, the price of heath care in the US is more expensive than comparable health care in Canada.

Going in the other direction from "Actual US" to "Ideal US", the gap represented by the bracket shows "Productive (in)Efficiency". Given the resources we allocate to health care we SHOULD be getting more/better health care output/outcomes. This is measured by going from "Ideal US" to a point on the vertical axis. We know we are not getting this level of health care outcomes given the resources used, so we are being productively inefficient in the delivery of health care. Productive Efficiency is achieved when the output is produced at minimum average total cost (AC). For example we might consider whether a business is producing close to the low point of its long run average total cost curve. When this happens the firm is exploiting most of the available economies of scale. Productive efficiency exists when producers minimise the wastage of resources in their production processes.

This graph accompanies a very interesting study (link above) on one of the reasons health care costs are high in the US. The focus is on the administrative costs of delivering health care in the US relative to other countries. Regardless of how you feel about the issue, I encourage you to read the whole thing.  We gotta get real if we want to control the cost of health care now and in the future....

HT: The Conversable Economist

Tuesday, January 25, 2011

The Presidents State of the Union Address and how it relates to the Production Possibilities Frontier---I told you I could do it!!

Here is how some of Pres. Obama's statements relate to the Production Possibilities Frontier.  I highlighted the key "buzzwords" I asked students to look out for.  All suggest an Allocative Efficiency decision to allocate more resources towards "Capital Formation"--moving to the production/development of more Capital/Infrastructure to create the conditions for true economic growth. On the graph below, we first have to move from Point "A" to Point "B" on the PPF (There is no such thing as a free lunch--Opportunity Costs!), before we can experience economic growth, illustrated by a shift to the right of the PPF. Economic growth is an increase in our potential to produce more goods (and services), both Capital and Consumer Goods.  Currently we are operating BELOW our potential, at a point inside our PPF.  It is important to remember the distinction between GDP growth, which is what we need to just get back to the PPF, and Economic growth, which I just described above as a shift to the right, or an increase, in our productive capacity.

""Meanwhile, nations like China and India realized that with some changes of their own, they could compete in this new world. And so they started educating their children earlier and longer, with greater emphasis on math and science. They’re investing in research and new technologies. Just recently, China became home to the world’s largest private solar research facility, and the world’s fastest computer.""


We know what it takes to compete for the jobs and industries of our time. We need to out-innovate, out-educate, and out-build the rest of the world.

But after investing in better research and education, we didn’t just surpass the Soviets; we unleashed a wave of innovation that created new industries and millions of new jobs.


We’ll invest in biomedical research, information technology, and especially clean energy technology – an investment that will strengthen our security, protect our planet, and create countless new jobs for our people.


Maintaining our leadership in research and technology is crucial to America’s success. But if we want to win the future – if we want innovation to produce jobs in America and not overseas – then we also have to win the race to educate our kids.


Our infrastructure used to be the best – but our lead has slipped. South Korean homes now have greater internet access than we do. Countries in Europe and Russia invest more in their roads and railways than we do. China is building faster trains and newer airports. Meanwhile, when our own engineers graded our nation’s infrastructure, they gave us a “D.”

We have to do better. America is the nation that built the transcontinental railroad, brought electricity to rural communities, and constructed the interstate highway system. The jobs created by these projects didn’t just come from laying down tracks or pavement. They came from businesses that opened near a town’s new train station or the new off-ramp.

 
Over the last two years, we have begun rebuilding for the 21st century, a project that has meant thousands of good jobs for the hard-hit construction industry. Tonight, I’m proposing that we redouble these efforts.

We will put more Americans to work repairing crumbling roads and bridges. We will make sure this is fully paid for, attract private investment, and pick projects based on what’s best for the economy, not politicians.

Within 25 years, our goal is to give 80% of Americans access to high-speed rail, which could allow you go places in half the time it takes to travel by car. For some trips, it will be faster than flying – without the pat-down. As we speak, routes in California and the Midwest are already underway.

All these investments – in innovation, education, and infrastructure – will make America a better place to do business and create jobs. But to help our companies compete, we also have to knock down barriers that stand in the way of their success.


To reduce barriers to growth and investment, I’ve ordered a review of government regulations. When we find rules that put an unnecessary burden on businesses, we will fix them.
View My Stats