This ticket to Disneyland in 1955 cost $1.00. In 1955 the minimum wage was $.75 (75 cents), so it took 1.33 hours of labor to earn enough to buy this one ticket in 1955.
Today, a ticket would cost you $105.00 to visit the Happiest Place on Earth. In 2016 the minimum wage (although it varies in States and even some localities) is $7.25 per hour. At that rate, a ticket would take 14.5 hours of labor (excluding labor taxes, of course).
A day at Disneyland in 1955 was definitely more affordable for a low wage worker 60 years ago. The only thing that really remains to be determined is the comparable quality of the experience. The parks are vastly different in composition.
Has the quality of the visit improved by a large enough factor to make the extra hours worked to buy a one-day pass more "utility maximizing" in 2017 than in 1955?
Economics, civics, constitutional law, Supreme Court cases, AP Economics teaching resources, and classroom lessons by a retired social studies teacher.
Showing posts with label inflation. Show all posts
Thursday, August 10, 2017
Friday, July 14, 2017
A 1967 Wrigley Field Menu Board and Inflation.
Found this HERE
It shows a menu board for concessions and game tickets at Wrigley Field in Chicago for the year 1967 (relying on information from the source).
In order to see what these prices are in today's dollars, multiply each number below by 7.43 (using the Bureau of Labor Statistics (BLS) inflation calculator)
/cdn.vox-cdn.com/uploads/chorus_asset/file/8286439/1967prices.jpg)
Example: An Oscar Mayer Hot Dog cost .30 cents in 1967. If the price of that hot dog simply increased in price at the pace of overall inflation, then it would cost you $2.23 (.30 cents X 7.43) at Wrigley today.
Go to Wrigley today and you will pay about $5.50. That is a factor increase of 18.33 from 1967, or a 2.5 times (18.33/7.43) increase over stated inflation.
There are lots of comparatives you can do with this menu board over a broad range of goods shown here. A nice way to help students understand the effects of inflation.
It shows a menu board for concessions and game tickets at Wrigley Field in Chicago for the year 1967 (relying on information from the source).
In order to see what these prices are in today's dollars, multiply each number below by 7.43 (using the Bureau of Labor Statistics (BLS) inflation calculator)
Go to Wrigley today and you will pay about $5.50. That is a factor increase of 18.33 from 1967, or a 2.5 times (18.33/7.43) increase over stated inflation.
There are lots of comparatives you can do with this menu board over a broad range of goods shown here. A nice way to help students understand the effects of inflation.
Saturday, November 19, 2016
Cost of Thanksgiving Day Meal in Minimum Wage Terms...
The American Farm Bureau has published its "annual informal price survey of classic items found on the Thanksgiving Day dinner table" Found HERE.
This year the items on the market basket (you can find those as well at the link) totaled $49.87.
In 2016 the minimum wage is $7.25 per hour. This means it takes a minimum wage worker 6.9 hours of labor to earn enough to purchase the meal.
In 1986 when the the AFB started doing this survey the basket totaled $28.74.
In 1986 the minimum wage was $3.35 per hour. This means it took a minimum wage worker 8.6 hours of labor to earn enough to purchase the meal.
That is a difference of 1.7 hours less the current worker works to earn enough for the meal.
This is not to suggest that we should be satisfied with the current minimum wage.
It only is a comparison of purchasing power from one time period to another in terms of, in isolation, buying basic items to celebrate a widely celebrated US holiday.
This year the items on the market basket (you can find those as well at the link) totaled $49.87.
In 2016 the minimum wage is $7.25 per hour. This means it takes a minimum wage worker 6.9 hours of labor to earn enough to purchase the meal.
In 1986 when the the AFB started doing this survey the basket totaled $28.74.
In 1986 the minimum wage was $3.35 per hour. This means it took a minimum wage worker 8.6 hours of labor to earn enough to purchase the meal.
That is a difference of 1.7 hours less the current worker works to earn enough for the meal.
This is not to suggest that we should be satisfied with the current minimum wage.
It only is a comparison of purchasing power from one time period to another in terms of, in isolation, buying basic items to celebrate a widely celebrated US holiday.
![]() |
| Source: American Farm Bureau |
Saturday, October 15, 2016
Calculating a Price Index and Rate of Inflation.
Calculating a "Market Basket" for purposes of creating a "Price Index" is tough for many students.
I am going to try to make it as easy as possible here.
Imagine a trip to Walmart to buy groceries and other non-grocery items. Usually we make a list of the things we want in advance of the trip.
We go into the store and get an empty grocery cart.
We then make our way around the store and buy the things on our list.
We then go up to the checkout station and someone takes each item and scans them in.
We see a running total on a little screen in front of us.
After all the items are scanned in we obtain a grand total for the "Market Basket" we purchased.
Assume this total is $200.00US. We pay and go home.
(Now an economist makes an entrance here to our story):
This person just bought $200.00 in stuff. Let's use this first shopping trip as our base of comparison to construct a "Price Index".
To do this we use a simple formula: The Current Value of the Market Basket divided by a Base Value of the Market Basket. Then Multiply that by 100 to put it in base 100 form.
So, our Current Value of the Market Basket is $200.00 and the Base Value of the Market Basket is also the same $200.00. Divide $200.00 by $200.00 you get 1.
Multiply by 100 and you get a "Base Price Index" or 100.
(Now we re-enter the scene at a later time):
Time to go to Walmart again! We take the EXACT SAME list with us.
We get get a cart and make our way around the store purchasing everything on our list.
We go to the checkout counter and get everything scanned in.
.
Now we see on the screen a total for our CURRENT MARKET BASKET for this trip of $220.00.
What is our Price Index now? Use the same formula as above: Current Value of the Market Basket divided by the Base Value of the Market Basket then Multiply by 100.
So: $220.00/$200.00 = 1.0 X 100 = 110.
Ok, so our Price Index went from 100 to 110. Easy enough.
But what we really want to know is what was the Rate of Change in Price Level between the time periods, or better known as the Inflation Rate (or it could be "deflation:)
For this we need to use another formula---the PERCENTAGE CHANGE formula. This will give us the percent change from the Base time period to the Current time period.
The Current Price Index minus the Base Value Price Index divided by the Base Value Price Index. Then take that number and Multiply by 100.
Read that formula again!
So, 110 minus 100 = 10. Divide 10 by 100 = .10. Multiply that by 100 and you have 10%.
The Inflation rate between the two time periods the Price Indexes were calculated was 10%.
Let's make the shopping trip one more time.
We buy the exact same things again and go to the checkout counter.
After all items are scanned in the total for this market basket is $250.00
What is our CURRENT PRICE INDEX? Current value of the Market Basket ($250.) divided by the Base Value Market Basket ($200.00) equals 1.25. Multiply by 100 and you get a Current Price Index of 125.
Now, there are TWO things you will be asked to calculate.
What was the Rate of Inflation from the Base time period (100) to the Current time period (125)?
Using the Rate of Change formula above: Current Price Index (125) minus Base Price Index (100) divided by Base Price Index (100) equals .25. Multiply by 100 equals an Inflation Rate of 25%.
HERE IS THE TRICKY ONE:
What was the Rate of Inflation from the Second time period (110) to the Current time period (125).
We need to make a slight but important change when plugging into the above formula.
The BASE Price Index is going to be the time period you want to calculate the percent change from. In this case it is the Second time period Price Index of 110.
So: Current Price Index (125) minus Base Price Index (110) equals 15. Divide 15 by Base Price Index (110) equals 13.6%.
The Rate of Inflation was 13.6% from the second time period to the third one.
That's it. Easy, right?
I am going to try to make it as easy as possible here.
Imagine a trip to Walmart to buy groceries and other non-grocery items. Usually we make a list of the things we want in advance of the trip.
We go into the store and get an empty grocery cart.
We then make our way around the store and buy the things on our list.
We then go up to the checkout station and someone takes each item and scans them in.
We see a running total on a little screen in front of us.
After all the items are scanned in we obtain a grand total for the "Market Basket" we purchased.
Assume this total is $200.00US. We pay and go home.
(Now an economist makes an entrance here to our story):
This person just bought $200.00 in stuff. Let's use this first shopping trip as our base of comparison to construct a "Price Index".
To do this we use a simple formula: The Current Value of the Market Basket divided by a Base Value of the Market Basket. Then Multiply that by 100 to put it in base 100 form.
So, our Current Value of the Market Basket is $200.00 and the Base Value of the Market Basket is also the same $200.00. Divide $200.00 by $200.00 you get 1.
Multiply by 100 and you get a "Base Price Index" or 100.
(Now we re-enter the scene at a later time):
Time to go to Walmart again! We take the EXACT SAME list with us.
We get get a cart and make our way around the store purchasing everything on our list.
We go to the checkout counter and get everything scanned in.
.
Now we see on the screen a total for our CURRENT MARKET BASKET for this trip of $220.00.
What is our Price Index now? Use the same formula as above: Current Value of the Market Basket divided by the Base Value of the Market Basket then Multiply by 100.
So: $220.00/$200.00 = 1.0 X 100 = 110.
Ok, so our Price Index went from 100 to 110. Easy enough.
But what we really want to know is what was the Rate of Change in Price Level between the time periods, or better known as the Inflation Rate (or it could be "deflation:)
For this we need to use another formula---the PERCENTAGE CHANGE formula. This will give us the percent change from the Base time period to the Current time period.
The Current Price Index minus the Base Value Price Index divided by the Base Value Price Index. Then take that number and Multiply by 100.
Read that formula again!
So, 110 minus 100 = 10. Divide 10 by 100 = .10. Multiply that by 100 and you have 10%.
The Inflation rate between the two time periods the Price Indexes were calculated was 10%.
Let's make the shopping trip one more time.
We buy the exact same things again and go to the checkout counter.
After all items are scanned in the total for this market basket is $250.00
What is our CURRENT PRICE INDEX? Current value of the Market Basket ($250.) divided by the Base Value Market Basket ($200.00) equals 1.25. Multiply by 100 and you get a Current Price Index of 125.
Now, there are TWO things you will be asked to calculate.
What was the Rate of Inflation from the Base time period (100) to the Current time period (125)?
Using the Rate of Change formula above: Current Price Index (125) minus Base Price Index (100) divided by Base Price Index (100) equals .25. Multiply by 100 equals an Inflation Rate of 25%.
HERE IS THE TRICKY ONE:
What was the Rate of Inflation from the Second time period (110) to the Current time period (125).
We need to make a slight but important change when plugging into the above formula.
The BASE Price Index is going to be the time period you want to calculate the percent change from. In this case it is the Second time period Price Index of 110.
So: Current Price Index (125) minus Base Price Index (110) equals 15. Divide 15 by Base Price Index (110) equals 13.6%.
The Rate of Inflation was 13.6% from the second time period to the third one.
That's it. Easy, right?
Calculating a Price Index and Rate of Inflation.
Calculating a "Market Basket" for purposes of creating a "Price Index" is tough for many students.
I am going to try to make it as easy as possible here.
Imagine a trip to Walmart to buy groceries and other non-grocery items. Usually we make a list of the things we want in advance of the trip.
We go into the store and get an empty grocery cart.
We then make our way around the store and buy the things on our list.
We then go up to the checkout station and someone takes each item and scans them in.
We see a running total on a little screen in front of us.
After all the items are scanned in we obtain a grand total for the "Market Basket" we purchased.
Assume this total is $200.00US. We pay and go home.
(Now an economist makes an entrance here to our story):
This person just bought $200.00 in stuff. Let's use this first shopping trip as our base of comparison to construct a "Price Index".
To do this we use a simple formula: The Current Value of the Market Basket divided by a Base Value of the Market Basket. Then Multiply that by 100 to put it in base 100 form.
So, our Current Value of the Market Basket is $200.00 and the Base Value of the Market Basket is also the same $200.00. Divide $200.00 by $200.00 you get 1.
Multiply by 100 and you get a "Base Price Index" or 100.
(Now we re-enter the scene at a later time):
Time to go to Walmart again! We take the EXACT SAME list with us.
We get get a cart and make our way around the store purchasing everything on our list.
We go to the checkout counter and get everything scanned in.
.
Now we see on the screen a total for our CURRENT MARKET BASKET for this trip of $220.00.
What is our Price Index now? Use the same formula as above: Current Value of the Market Basket divided by the Base Value of the Market Basket then Multiply by 100.
So: $220.00/$200.00 = 1.0 X 100 = 110.
Ok, so our Price Index went from 100 to 110. Easy enough.
But what we really want to know is what was the Rate of Change in Price Level between the time periods, or better known as the Inflation Rate (or it could be "deflation:)
For this we need to use another formula---the PERCENTAGE CHANGE formula. This will give us the percent change from the Base time period to the Current time period.
The Current Price Index minus the Base Value Price Index divided by the Base Value Price Index. Then take that number and Multiply by 100.
Read that formula again!
So, 110 minus 100 = 10. Divide 10 by 100 = .10. Multiply that by 100 and you have 10%.
The Inflation rate between the two time periods the Price Indexes were calculated was 10%.
Let's make the shopping trip one more time.
We buy the exact same things again and go to the checkout counter.
After all items are scanned in the total for this market basket is $250.00
What is our CURRENT PRICE INDEX? Current value of the Market Basket ($250.) divided by the Base Value Market Basket ($200.00) equals 1.25. Multiply by 100 and you get a Current Price Index of 125.
Now, there are TWO things you will be asked to calculate.
What was the Rate of Inflation from the Base time period (100) to the Current time period (125)?
Using the Rate of Change formula above: Current Price Index (125) minus Base Price Index (100) divided by Base Price Index (100) equals .25. Multiply by 100 equals an Inflation Rate of 25%.
HERE IS THE TRICKY ONE:
What was the Rate of Inflation from the Second time period (110) to the Current time period (125).
We need to make a slight but important change when plugging into the above formula.
The BASE Price Index is going to be the time period you want to calculate the percent change from. In this case it is the Second time period Price Index of 110.
So: Current Price Index (125) minus Base Price Index (110) equals 15. Divide 15 by Base Price Index (110) equals 13.6%.
The Rate of Inflation was 13.6% from the second time period to the third one.
That's it. Easy, right?
I am going to try to make it as easy as possible here.
Imagine a trip to Walmart to buy groceries and other non-grocery items. Usually we make a list of the things we want in advance of the trip.
We go into the store and get an empty grocery cart.
We then make our way around the store and buy the things on our list.
We then go up to the checkout station and someone takes each item and scans them in.
We see a running total on a little screen in front of us.
After all the items are scanned in we obtain a grand total for the "Market Basket" we purchased.
Assume this total is $200.00US. We pay and go home.
(Now an economist makes an entrance here to our story):
This person just bought $200.00 in stuff. Let's use this first shopping trip as our base of comparison to construct a "Price Index".
To do this we use a simple formula: The Current Value of the Market Basket divided by a Base Value of the Market Basket. Then Multiply that by 100 to put it in base 100 form.
So, our Current Value of the Market Basket is $200.00 and the Base Value of the Market Basket is also the same $200.00. Divide $200.00 by $200.00 you get 1.
Multiply by 100 and you get a "Base Price Index" or 100.
(Now we re-enter the scene at a later time):
Time to go to Walmart again! We take the EXACT SAME list with us.
We get get a cart and make our way around the store purchasing everything on our list.
We go to the checkout counter and get everything scanned in.
.
Now we see on the screen a total for our CURRENT MARKET BASKET for this trip of $220.00.
What is our Price Index now? Use the same formula as above: Current Value of the Market Basket divided by the Base Value of the Market Basket then Multiply by 100.
So: $220.00/$200.00 = 1.0 X 100 = 110.
Ok, so our Price Index went from 100 to 110. Easy enough.
But what we really want to know is what was the Rate of Change in Price Level between the time periods, or better known as the Inflation Rate (or it could be "deflation:)
For this we need to use another formula---the PERCENTAGE CHANGE formula. This will give us the percent change from the Base time period to the Current time period.
The Current Price Index minus the Base Value Price Index divided by the Base Value Price Index. Then take that number and Multiply by 100.
Read that formula again!
So, 110 minus 100 = 10. Divide 10 by 100 = .10. Multiply that by 100 and you have 10%.
The Inflation rate between the two time periods the Price Indexes were calculated was 10%.
Let's make the shopping trip one more time.
We buy the exact same things again and go to the checkout counter.
After all items are scanned in the total for this market basket is $250.00
What is our CURRENT PRICE INDEX? Current value of the Market Basket ($250.) divided by the Base Value Market Basket ($200.00) equals 1.25. Multiply by 100 and you get a Current Price Index of 125.
Now, there are TWO things you will be asked to calculate.
What was the Rate of Inflation from the Base time period (100) to the Current time period (125)?
Using the Rate of Change formula above: Current Price Index (125) minus Base Price Index (100) divided by Base Price Index (100) equals .25. Multiply by 100 equals an Inflation Rate of 25%.
HERE IS THE TRICKY ONE:
What was the Rate of Inflation from the Second time period (110) to the Current time period (125).
We need to make a slight but important change when plugging into the above formula.
The BASE Price Index is going to be the time period you want to calculate the percent change from. In this case it is the Second time period Price Index of 110.
So: Current Price Index (125) minus Base Price Index (110) equals 15. Divide 15 by Base Price Index (110) equals 13.6%.
The Rate of Inflation was 13.6% from the second time period to the third one.
That's it. Easy, right?
Thursday, September 29, 2016
Found this on a Twitter account I follow---Restaurant News. (It has some great stuff for analyzing Microeconomic concepts from an industry students are very familiar with, one way or the other).
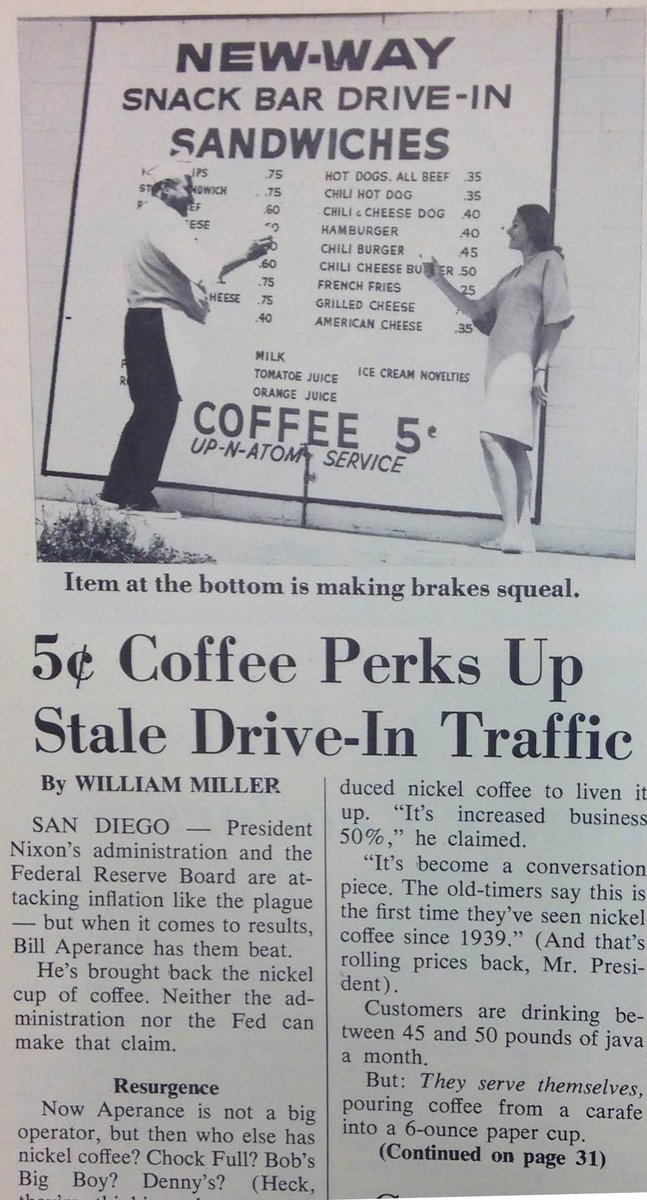
It is a menu board for a restaurant (as Restaurant News says) in 1969 and just the kind of thing that makes for a short economics lesson!
The price of a cup of coffee (does not say how many ounces it is) is 5 cents---a nickel.
Friday, August 5, 2016
Adjusting for inflation, how have 4 major Chicken Fast Food Restaurants fared since 1991?
I saw the graphic below on a twitter account I follow from Nations Restaurant News.
The numbers you see are in "millions"--put 6 zeroes at the end of the numbers (in front of the decimal) to get the full value.
It shows sales figures for 4 major chicken chains in 1992 (blue column is 1991 sales figures). These numbers are interesting as they stand, I suppose, but what do they represent in more current dollars?
I used the column in BLUE as it is a firm dollar amount from the prior year--1991. I used the Bureau of Labor Statistics calculator to adjust the numbers into 2014 dollars. Those numbers are in the box "2014 Dollars (Inflation Adjusted)".
The RED arrows point to the inflation adjusted sales figure. Example: For KFC, sales of $3,200,000,000 ($3.2 Billion dollars) in 1991 would be equivalent to $5,562,000,000 ($5.525 Billion dollars) in 2014 dollars.
I used 2014 because from HERE I was able to find the latest yearly sales figures for these 4 companies. Those numbers are in the box "2014 Actual Sales".
Now, this is the fun part! Look at the differences that occurred over time.
Actual Total Sales for all 4 chains are 71% higher than the inflation adjusted figure. It is good to be in the chicken business, right?
What other observations can you make about these 4 companies?
The numbers you see are in "millions"--put 6 zeroes at the end of the numbers (in front of the decimal) to get the full value.
It shows sales figures for 4 major chicken chains in 1992 (blue column is 1991 sales figures). These numbers are interesting as they stand, I suppose, but what do they represent in more current dollars?
I used the column in BLUE as it is a firm dollar amount from the prior year--1991. I used the Bureau of Labor Statistics calculator to adjust the numbers into 2014 dollars. Those numbers are in the box "2014 Dollars (Inflation Adjusted)".
The RED arrows point to the inflation adjusted sales figure. Example: For KFC, sales of $3,200,000,000 ($3.2 Billion dollars) in 1991 would be equivalent to $5,562,000,000 ($5.525 Billion dollars) in 2014 dollars.
I used 2014 because from HERE I was able to find the latest yearly sales figures for these 4 companies. Those numbers are in the box "2014 Actual Sales".
Now, this is the fun part! Look at the differences that occurred over time.
Actual Total Sales for all 4 chains are 71% higher than the inflation adjusted figure. It is good to be in the chicken business, right?
What other observations can you make about these 4 companies?
Monday, July 4, 2016
Theme Park Price Index and the Disney Effect.
I saw this line graph on my Twitter feed from the FRED data bank. It shows the change in the price index for "Amusement and Theme Parks" admission ticket prices.
They started at the beginning of 2006 with an index of 100. As of May, 1 2016 the index was just a touch over 180. This means that theme park ticket prices overall have increased by 80% in that time span.
My first thought when I saw this was what is the impact of Disney on the price of tickets. I found this website which tracks their price changes.
I inserted RED bars (month and year on top) that show all of the Disney price increases (they had no price decreases) in this time period.
At the beginning of 2006 a single one day ticket to a Disney park was priced at $63.00 (see link above). Today a single day ("regular" price) is $110.00. That is a 75% increase!
Remember, theme park (Six Flags et al) tickets increased by 80% overall. Disney accounts for a disproportionate amount of that change.
If Disney admission tickets had just kept up with inflation during that time (using the CPI), ticket prices should only be $75.05, a 19.1% increase.
Seems clear that Disney is a "Price Maker" as opposed to a "Price Taker" and they are a "Price Leader" as well. However, the latter is harder to discern without doing the math.
When Disney raised prices did other theme parks follow suit at the same time? If you look at the times in-between Disney price increases (gotta look really close) there seems to be a bump up in the line indicating a lag (sometimes short, sometimes longer) when other theme parks followed with price increases.
I did find it interesting that Disney elected to increase prices in the dead middle of the Great Recession (noted on graph in gray area).
Pricing power, indeed!
They started at the beginning of 2006 with an index of 100. As of May, 1 2016 the index was just a touch over 180. This means that theme park ticket prices overall have increased by 80% in that time span.
I inserted RED bars (month and year on top) that show all of the Disney price increases (they had no price decreases) in this time period.
At the beginning of 2006 a single one day ticket to a Disney park was priced at $63.00 (see link above). Today a single day ("regular" price) is $110.00. That is a 75% increase!
Remember, theme park (Six Flags et al) tickets increased by 80% overall. Disney accounts for a disproportionate amount of that change.
If Disney admission tickets had just kept up with inflation during that time (using the CPI), ticket prices should only be $75.05, a 19.1% increase.
Seems clear that Disney is a "Price Maker" as opposed to a "Price Taker" and they are a "Price Leader" as well. However, the latter is harder to discern without doing the math.
When Disney raised prices did other theme parks follow suit at the same time? If you look at the times in-between Disney price increases (gotta look really close) there seems to be a bump up in the line indicating a lag (sometimes short, sometimes longer) when other theme parks followed with price increases.
I did find it interesting that Disney elected to increase prices in the dead middle of the Great Recession (noted on graph in gray area).
Pricing power, indeed!
Tuesday, October 7, 2014
NFL prices in 1989 and today. Nice lesson on Inflation.
I found this on Twitter (I do not have the original link).
Shows how much a Season Ticket Package for all the NFL teams cost in 1989 (or it could be 1990, it does not show) in the far right column.
I am assuming the numbers for each year are the number of season ticket packages that were sold then the percent change from 1988 to 1989.
Divide each package by 8 games and you will get the single game price.
Below is a price list for 2013. The yellow highlighted section is for average individual, single game tickets.
Compare the single game price average in 1989 (divide the season package price by 8) with the prices below.
General inflation has increase 92% since 1989 (put $1.00 in the BLS calculator for 1989)
The 1988 (season) Super Bowl Champion was the SF 49ers.
A single game ticket now costs about $84 on average ($275 for a premium ticket). In 1989 you could get an 8 game season ticket for $250.00, for an average game price of $31.25. Depending on how much of a break one gets today on the season ticket cost for that seat it may very well work out that a ticket to a 49ers game has kept up with inflation (more likely it has fell behind, though). We would have to compare a comparable seat.
Have fun with your favorite team and see how much prices have increased relative to inflation.
Shows how much a Season Ticket Package for all the NFL teams cost in 1989 (or it could be 1990, it does not show) in the far right column.
I am assuming the numbers for each year are the number of season ticket packages that were sold then the percent change from 1988 to 1989.
Divide each package by 8 games and you will get the single game price.
Below is a price list for 2013. The yellow highlighted section is for average individual, single game tickets.
Compare the single game price average in 1989 (divide the season package price by 8) with the prices below.
General inflation has increase 92% since 1989 (put $1.00 in the BLS calculator for 1989)
The 1988 (season) Super Bowl Champion was the SF 49ers.
A single game ticket now costs about $84 on average ($275 for a premium ticket). In 1989 you could get an 8 game season ticket for $250.00, for an average game price of $31.25. Depending on how much of a break one gets today on the season ticket cost for that seat it may very well work out that a ticket to a 49ers game has kept up with inflation (more likely it has fell behind, though). We would have to compare a comparable seat.
Have fun with your favorite team and see how much prices have increased relative to inflation.
![]() |
| Source: HERE |
Friday, October 3, 2014
Having fun with 1938 prices.
Nice graphic showing a cross-section of prices in 1938 (Link HERE). How have things changed?
Here are the same prices with the inflation adjusted figure in parenthesis. In other words, if these individual 1938 prices kept pace with overall inflation then the amount in parenthesis would be what those items would cost in today's dollars.
New House: $3,900.00 ($65,788.85)
Average Income: $1,731.00/year ($29,200.13)
New Car: $860 ($14,507.29)
Average Rent: $27.00/month ($455.46)
Tuition to Harvard University: $420.00/year ($7,084.95)
Movie Ticket: $.25 ($4.22)
Gasoline: $.10/gallon ($1.69)
US Postage Stamp: $.10 ($1.69)
Granulated Sugar: $.59 for 10 pounds ($9.95)
Vitamin D Milk: $.50/gallon ($8.43)
Ground Coffee: $.39/pound ($6.58)
Bacon: $.32/pound ($5.40)
Eggs: $.18/dozen ($3.04)
One way to look at this: If the number in parenthesis is GREATER than what you would pay for that good today, then over time the price of that good has risen LESS than inflation. You can look at this as a good thing.
Couple of observations:
A stamp to mail a letter today is $.49. If it had increased with general rate of inflation since 1938 it would be $1.69 today.
I am pretty sure just ONE class at Harvard costs $7,000 today so the cost of Harvard has increase MUCH more than the general rate of inflation.
A movie ticket (general admission, not discounted) is more than $4.22 today.
You might say the price of a new car has stayed the same. You could buy a car today for $14,507 that one could argue is BETTER than a car built in 1938 in terms of features.
Probably gets beat on style, though! :)
It is interesting to me to look at history through the prism of prices. What do you see?
![]() |
| Source: Classic Pics on Twitter |
New House: $3,900.00 ($65,788.85)
Average Income: $1,731.00/year ($29,200.13)
New Car: $860 ($14,507.29)
Average Rent: $27.00/month ($455.46)
Tuition to Harvard University: $420.00/year ($7,084.95)
Movie Ticket: $.25 ($4.22)
Gasoline: $.10/gallon ($1.69)
US Postage Stamp: $.10 ($1.69)
Granulated Sugar: $.59 for 10 pounds ($9.95)
Vitamin D Milk: $.50/gallon ($8.43)
Ground Coffee: $.39/pound ($6.58)
Bacon: $.32/pound ($5.40)
Eggs: $.18/dozen ($3.04)
One way to look at this: If the number in parenthesis is GREATER than what you would pay for that good today, then over time the price of that good has risen LESS than inflation. You can look at this as a good thing.
Couple of observations:
A stamp to mail a letter today is $.49. If it had increased with general rate of inflation since 1938 it would be $1.69 today.
I am pretty sure just ONE class at Harvard costs $7,000 today so the cost of Harvard has increase MUCH more than the general rate of inflation.
A movie ticket (general admission, not discounted) is more than $4.22 today.
You might say the price of a new car has stayed the same. You could buy a car today for $14,507 that one could argue is BETTER than a car built in 1938 in terms of features.
Probably gets beat on style, though! :)
It is interesting to me to look at history through the prism of prices. What do you see?
Sunday, June 1, 2014
"Food Inflation" is on its way in 2014. But the reason for it is not what you may think it is.
"Food inflation" is likely on its way to the US, and the world for that matter.
When we here the word "inflation" the first thought is usually "too much money chasing too few goods (services)" and look to Monetary policy as the culprit. Maybe...but maybe not. Sometimes the fundamentals of Supply and Demand in various markets are at play.
Here are data from the USDA ERS site that show the change in prices of the basic food groups for the past couple of years and projections for the remainder of this year. Does not look encouraging at the checkout line.
If you go to the site they give a nice overview of the why prices in select categories are increasing.
The short story version is there seems to be a perfect storm of variables coming together to conspire to raise prices---weather and disease (plant and animal) working to limit or decrease supply on the Supply-Side. Demand from recovering developed economies (US, Europe) and emerging developing countries (China, India, etc) is putting upward pressure on the constrained food supply chain.
Here is one interesting point made in the USDA ERS analysis I think is important to understand as well.
Grocery stores have to consider YOUR whole grocery basket of stuff you purchase when pricing their products AND what other stores are doing at the same time. They may play a little "rob Peter to pay Paul" with the inventory. In order to minimize the price increases of the perishable goods you see above, they will likely decrease prices of other non-perishable goods where they may have more pricing discretion.
So, market fundamentals are increasing the prices of many diverse individual food items at the same time, and competition between stores is working to minimize (albeit not stop) those price increases.
That is what I call a reasonable explanation. Maybe not one that makes us happy, but more reasonable than the one I started out with.
It only took a little more work. :)
When we here the word "inflation" the first thought is usually "too much money chasing too few goods (services)" and look to Monetary policy as the culprit. Maybe...but maybe not. Sometimes the fundamentals of Supply and Demand in various markets are at play.
Here are data from the USDA ERS site that show the change in prices of the basic food groups for the past couple of years and projections for the remainder of this year. Does not look encouraging at the checkout line.
If you go to the site they give a nice overview of the why prices in select categories are increasing.
The short story version is there seems to be a perfect storm of variables coming together to conspire to raise prices---weather and disease (plant and animal) working to limit or decrease supply on the Supply-Side. Demand from recovering developed economies (US, Europe) and emerging developing countries (China, India, etc) is putting upward pressure on the constrained food supply chain.
![]() |
| Source: USDA ERS |
Additionally, it appears as if supermarkets are maintaining minimal price inflation on packaged food products, possibly in an effort to keep prices competitive in light of rising cost pressures for most perishable items. Therefore, ERS has revised the forecast for sugar and sweets downward to 1 to 2 percent and for nonalcoholic beverages downward to 1.5 to 2.5 percent for 2014.Competition serves to minimize, or at least soften, the REAL changes in prices of many goods at the actual point of purchase.
Grocery stores have to consider YOUR whole grocery basket of stuff you purchase when pricing their products AND what other stores are doing at the same time. They may play a little "rob Peter to pay Paul" with the inventory. In order to minimize the price increases of the perishable goods you see above, they will likely decrease prices of other non-perishable goods where they may have more pricing discretion.
So, market fundamentals are increasing the prices of many diverse individual food items at the same time, and competition between stores is working to minimize (albeit not stop) those price increases.
That is what I call a reasonable explanation. Maybe not one that makes us happy, but more reasonable than the one I started out with.
It only took a little more work. :)
Wednesday, May 7, 2014
Purchasing power of money and McDonalds. Let's go back to the Disco Era
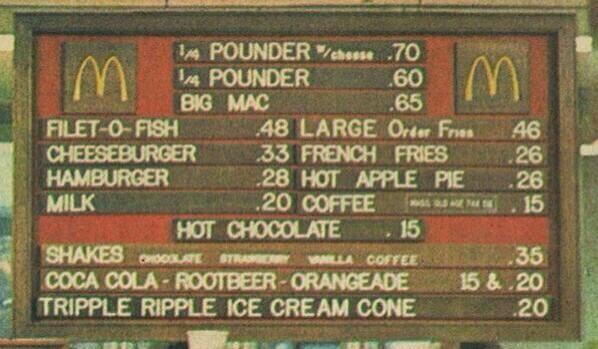
This menu board I posted yesterday gives me food for thought (pardon the pun). It makes it easy to compare the purchasing power of wages in different time periods if you have actual prices people paid for things at the time.
Using these prices I can quickly show the purchasing power of the dollars in (1) the prevailing minimum wage and the average wage paid to workers (that data can be found HERE at the St Louis Fed Reserve)
In 1974 the minimum wage was $1.60 per hour (from HERE). The cost in nominal (current) dollars to purchase a Big Mac, Large Fry and a Large Soft Drink in 1974 was $1.31 ($.65+$.46+$.20 from prices below).
It would take a minimum wage worker earning $1.60 per hour (NOT subtracting payroll taxes) 49 minutes to earn enough to purchase the meal.
Today a Big Mac Combo Meal costs $5.69 (Price HERE). At worker earning $7.25 would have to work 47 minutes to get the meal deal.
The average wage for a "production worker and non-supervisory" job in 1974 was $4.45. It would have taken this person 17 minutes to purchase the $1.31 meal.
In 2014 the average wage for the same class of worker was $20.49. It would have taken this person 17 minutes (16.8 actually) to purchase the combo at $5.69.
By EITHER measure the purchasing power of the minimum wage AND the average worker wage are about the same, 40 years apart.
So, the conclusion? No great shakes, but by this measure the purchasing power of wages, minimum and average, have not lost ground BUT it have not gained either.
What is that saying about Kissing Your Sister?
Thursday, December 19, 2013
How much would it cost to buy the items in the song "The Twelve Days of Christmas"? See them here and how they have changed over time...
Every year for the past 30 years the bank PNC has compiled the prices of the items contained in the traditional Christmas song "The Twelve Days of Christmas". If you were REALLY going to give these as gifts what would the prices be and how have those prices changed over time. It is a fun way to learn about the Consumer Price Index (CPI).
Click on image to make larger or go HERE .
Here is a more detailed analysis of the prices and percentage change from last year and from 1984 when the index was started
![]() |
| Source: PNC |
Tuesday, May 21, 2013
Food prices in 1913 and today. Which do you think is a better deal? More convinced than ever that there are no Good ol' Days--except for the ones we are in now...
The data below are from a BLS report on prices. It shows basic food staples as they were priced in 1913 and in 2013.
The total market basket cost for these items in 1913 = $3.19 (adjusted for inflation (using the BLS calculator) that would be $74.93 in 2013 dollars).
In 2013 those same items totaled = $49.71 (current dollars)
On an inflation adjusted basis, these food items today are 33% cheaper than in 1913.
Another way to look at this would be to calculate how many hours, at the prevailing wage, a worker would have to work to earn enough to purchase the items in this market basket.
It is hard to find exact data on wage rates in 1913 but I am going to use this BLS source and guesstimate about $.50 per hour (that is probably high) and the average hourly wage of a worker in 2013 is $23.87 (Source)
So...a working stiff in 1913 would have to work 6.38 hours to earn enough for the groceries and a worker in 2013 would have to work only 2.08 hours for those same groceries.
When would you rather live---today or then? I choose today. I am pretty sure I could sneak a bag of Cheetos in my market basket. Something those old timers could NEVER do!! :)
The total market basket cost for these items in 1913 = $3.19 (adjusted for inflation (using the BLS calculator) that would be $74.93 in 2013 dollars).
In 2013 those same items totaled = $49.71 (current dollars)
On an inflation adjusted basis, these food items today are 33% cheaper than in 1913.
| Source: Bureau of Labor Statistics |
Another way to look at this would be to calculate how many hours, at the prevailing wage, a worker would have to work to earn enough to purchase the items in this market basket.
It is hard to find exact data on wage rates in 1913 but I am going to use this BLS source and guesstimate about $.50 per hour (that is probably high) and the average hourly wage of a worker in 2013 is $23.87 (Source)
So...a working stiff in 1913 would have to work 6.38 hours to earn enough for the groceries and a worker in 2013 would have to work only 2.08 hours for those same groceries.
When would you rather live---today or then? I choose today. I am pretty sure I could sneak a bag of Cheetos in my market basket. Something those old timers could NEVER do!! :)
Saturday, November 24, 2012
Average hourly wages for large retailers. How accurate are they??
I have not worked retail in quite some time. I would appreciate anyone seeing this and have worked for any of these companies (or in similar one) confirming these numbers are about right or if they are high or low. From the source, it seems these are "average hourly wages", so new-hires to experienced workers wages are included. Just curious as to how accurate these are. Thanks!
![]() |
| Source: Quartz |
Wednesday, November 21, 2012
A Thanksgiving Day meal costs 71% more compared to 1986 but it takes the average worker TODAY 45 minutes less to earn the money for that meal. This must mean we are better off, right?
Have to give an economics twist on the holiday. A requirement for an Econ teacher.
Here are a couple of graphics from The Conversable Economist.
The first shows, in inflation adjusted dollars, the change in cost of a shopping basket (literally) of some typical food items needed to prepare a Thanksgiving meal. Not inclusive of everything, but a representation.
Look at the blue line. Pretty flat over time, with a pretty big dip on the left and an up turn on the right. This means, after adjusting for inflation, the cost of this basket of goods has remained fairly consistent. Ok, that is good news, I suppose.
But what about the average consumers ABILITY to purchase these goods in any given year?
One measure is to look at how many hours of work, given a persons wage, does it take to purchase this market basket of goodies.
In 1986 the nominal average hourly wage was $8.94 (average for the year--Data HERE--BEFORE TAXES). So in 1986 a worker had to work ($28.74 / $8.94) 3 hours and 15 minutes to pay for the market basket.(the prices for each years market basket are below)
In 2011 the nominal average hourly wage was $19.46 (before taxes). In 2011 a worker had to work ($49.20 / $19.46) 2 hours and 32 minutes to pay for the same market basket.
The average worker today worked 45 minutes less to earn the money for Thanksgiving dinner than he/she did in 1986.
Variables to consider: If taxes and/or other deductions are higher today than the nominal wage would certainly be lower, hence take more time to purchase the market basket. Are the quality of the goods in the basket better, worse, the same? What else am I missing? Start a list...
Here are a couple of graphics from The Conversable Economist.
The first shows, in inflation adjusted dollars, the change in cost of a shopping basket (literally) of some typical food items needed to prepare a Thanksgiving meal. Not inclusive of everything, but a representation.
| Source: The Farm Bureau Federation via The Conversable Economist |
But what about the average consumers ABILITY to purchase these goods in any given year?
One measure is to look at how many hours of work, given a persons wage, does it take to purchase this market basket of goodies.
In 1986 the nominal average hourly wage was $8.94 (average for the year--Data HERE--BEFORE TAXES). So in 1986 a worker had to work ($28.74 / $8.94) 3 hours and 15 minutes to pay for the market basket.(the prices for each years market basket are below)
In 2011 the nominal average hourly wage was $19.46 (before taxes). In 2011 a worker had to work ($49.20 / $19.46) 2 hours and 32 minutes to pay for the same market basket.
The average worker today worked 45 minutes less to earn the money for Thanksgiving dinner than he/she did in 1986.
Variables to consider: If taxes and/or other deductions are higher today than the nominal wage would certainly be lower, hence take more time to purchase the market basket. Are the quality of the goods in the basket better, worse, the same? What else am I missing? Start a list...
| Source: Farm Bureau Federation |
Wednesday, August 29, 2012
Nice Infographic showing the decrease in the size of packaging for some of your favorite products. Inflation without an increase in price. I feel ripped-off.
This infographic illustrates "hidden" inflation that may not adequately captured in the governments compilation of the Consumer Price Index (CPI)---what the Federal govt. uses to measure general changes in prices from one time period to another, resulting in a measure of inflation or deflation.
If from one CPI measuring period to another the contents of a good you purchase is sold in a smaller quantity (on a per ounce or per piece basis) BUT the price of the good remains the same, is isn't that an increase in the price of the good without, well, an increase in the price of the good?
I buy less quantity at the same price as before the "shrinkage"---My purchasing power has decreased.
The increase in the price of one good, or even a whole category of goods, is not considered inflation ("A general rise in prices"). BUT I do FEEL poorer after looking at the chart below and see how I am getting less for more.
How about you??
If from one CPI measuring period to another the contents of a good you purchase is sold in a smaller quantity (on a per ounce or per piece basis) BUT the price of the good remains the same, is isn't that an increase in the price of the good without, well, an increase in the price of the good?
I buy less quantity at the same price as before the "shrinkage"---My purchasing power has decreased.
The increase in the price of one good, or even a whole category of goods, is not considered inflation ("A general rise in prices"). BUT I do FEEL poorer after looking at the chart below and see how I am getting less for more.
How about you??
![]() |
| Source: Good Morning Inforgraphics |
Wednesday, April 27, 2011
A nice primer on Inflation and who it hurts and who it helps...Yes, inflation can be your friend...
Inflation-talk is the rage right now, domestically and internationally. It is still open to debate whether we are in the midst of the classic definition of inflation---a general rise in the average price level---or do we just have increasing prices in a limited, but vital, number of commodities (gas and food, primarily). This blog post from "Supply and Demand--In that order" is a nice primer on the topic of the effects of inflation on all the interested parties...
""Normally, inflation is one of the most harmful taxes, but these days inflation may do less harm than good.
During most of our lifetimes, the prices of things we buy have generally increased over time. We can name some exceptions, but most items (even houses) have prices that are higher now than they were 10, 20 or 30 years ago. This general increase in consumer prices is called inflation.
The Federal Reserve is charged with limiting the rate of inflation, which it can do over the long run by limiting the supply of money and similar assets in the hands of the public.
Inflation is widely disliked. A number of economists think that inflation’s bad reputation is undeserved, and that, while people complain that inflation makes things more expensive, they fail to recognize that inflation also raises their wages.
The net result of inflation could be to increase wages and prices in the same proportion, without harming consumer’s purchasing power.
A person on a fixed income, such as a pensioner receiving a specific number of dollars a month – a so-called “defined benefit” pension – does have less purchasing power when prices rise. However, Social Security benefits automatically increase with wages in the economy, and thereby automatically increase with inflation in the long run.
Subscribe to:
Posts (Atom)