Showing posts with label Federal Budget. Show all posts

Tuesday, September 9, 2014

Education Spending in the OECD countries. How does the US stack up against the rest?

This terrific interactive is from the OECD website, the statistic gathering arm of the European Union.

See how various countries stack up in terms of spending on the various levels of education--from Pre-K through College ("Tertiary").

The BLUE line is the OECD average among the countries you see listed below.

The other tabs along the top offer interesting information regarding educational attainment.  This resource can be used for all kinds of analysis students could do in small discusssion groups.


Wednesday, March 12, 2014

More evidence the Federal government is a book-keeper and not a doer.

Here is some isolated data from the just released 2015 Budget Outlook by the White House.

Once again I find myself staring at numbers that demonstrate the Federal Government has become more of an entity that writes checks ("Transfer Payments") to people and less of one that "does things".

Below you see blocks of decades and a high lighted portion that shows transfer payments as a percent of ALL Federal government outlays for that last year of the decade (it is NOT an average for the decade).

Less of the budget spent on transfers, more available for "fun stuff" like defense, roads, bridges, education, space program, etc ad infinitum...sort of.

In 1950 we could spend 68% of the budget on all those fun things.  In 2014 we have only 30% to spend.

I am not saying this is a good thing or a bad thing, but it IS a thing.

I think most people don't give this much consideration on either side of the political spectrum when debates about the Federal budget take place.  Did I say "debates"?  Oh, I meant shouting matches. My bad.


One observation.  I do not know what happened in the 1950's that almost doubled private transfer payments (before dipping again in the 60's) but if I had to guess I would say it was a result of the GI Bill and the various benefits conferred on WWII vets.

Anyone else have any idea(s)???

Friday, December 13, 2013

How is the Federal Budget like a loaf of bread? You got your Texas Toast and your breadcrumbs. Which one will fill you up faster? Congress seems to think it is the breadcrumbs....

A nice quick reference visual that gives you an idea of of the relationship between Mandatory ("Non-Discretionary") and Discretionary ("Non-Mandatory") spending in the US Federal budget.

To use a baked good analogy, a loaf of bread, mandatory spending items are thickly cut slices of bread. Think Texas Toast (the BIG circles)! Non-mandatory spending item are either (1) thin slices, like crostini's (medium sized circles), or (2) even smaller pieces, like breadcrumbs used for Thanksgiving stuffing (the small circles).

In budget negotiations politicians are trying to make a political meal out of the breadcrumbs (cutting the small-ish things) and think it will nourish the Federal budget body and make it healthy.

The real "bread", if you will, is in the Texas Toast. However, it is neglected, left to mold, and get crusty.

Oh, well, whichever side YOU butter your bread I hope you find this graphic warm and toasty.

Source: Mother Jones

Tuesday, March 12, 2013

More evidence that the Federal Budget is about Health Care spending and not much else.

How times have changed regarding the Federal Budget.  In 1960, 50% of the Federal budget was allocated to National Defense. In the 2010 budget it accounted for 19%. 

Like squeezing a balloon, virtually all of the difference has been a movement from Defense to Federal spending on Health Care programs. 

Source: Color coded pie charts copied from AEI but from a study by the Philadelphia Federal Reserve
To put this in perspective I will adjust for inflation and put 1960 spending in terms of what that means in today's dollars.  I think that will be helpful in understanding the scope of issue
Defense spending in 1960 dollars was $53 Billion dollars (source HERE). Adjusting for inflation, that would be equivalent to $390 billion in today's dollars. Actual Defense spending in 2010 was $872 Billion---a 2.25 fold increase OVER inflation.
Health care spending in 1960 was $1.5 Billion dollars (source HERE). Adjusting for inflation, that would be equivalent to $11 Billion in today's dollars. Actual Federal spending on health care in 2010 was $846 Billion----a 77 fold increase OVER inflation. YIKES!! But hold on...
 Caveat:  The Federal program Medicare did not kick in until 1965-66 time period so spending in 1960 on health care might be considered low.  Let's use 1970 for Federal health care spending and use that as the base.
Health care spending in 1970 was $12.1 Billion dollars. Adjusting for inflation, that would be equivalent to $68 billion today. Given health care spending in 2010 was $846 billion that would be a 12.5 fold increase over inflation.
Defense spending in 1970 was $95 billion. In today's dollars that is equivalent to $534 billion, Given actual Defense spending in 2010 was $872 billion, that is a 1.6 fold increase over inflation.
To be more accurate and relevant, the economist who wrote this report probably should have used a post-Medicare implementation time period to use as a base.  Given the realities of the Baby Boom generation, that would have been more helpful.


Thursday, November 29, 2012

Yesterday I showed you how someone with an income of $45,000 can pay NO Federal income tax (47%-er) . Today I use the same household and show you how they are a major tax PAYER. These things are never as easy as they appear...

Yesterday I wrote a blog entry on how a person or household with an income of $45,000 can end up paying no Federal Income tax on that income and can actually be a net recipient of tax dollars (.  See that HERE.

Today, I want to show that this same household DOES pay federal taxes, but not necessarily the Income Tax. The taxes they cannot escape paying are Payroll Taxes,---Social Security and Medicare taxes. These taxes are dedicated to paying benefits for retirees and other eligible recipients.

The Social Security tax is 6.2% of income and it is applied to income earned up to $110,100.  Any income OVER this amount is NOT subject to the Social Security tax.  So the MAXIMUM that can deducted from someones paycheck is $6,826.20 ($110,100 X 6.2%).  For our sample household, they would pay $2,790 ($45,000 X 6.2%) in Social Security taxes.

The Medicare tax is 1.45% of income and it has NO INCOME LIMIT! As with tax policy, it depends of the what the definition of "income" is. Capital gains and dividends are excluded from the Medicare tax (Social Security tax too), which are generally the province of "the wealthy".  So, our household pays $652.50 ($45,000 X 1.45%) in Medicare taxes.

Remember, these are MANDATORY TAXES. 

The total payroll taxes paid by our sample household is ($6,826.20 + $652.50) $7,478.70.

Federal Income taxes AND payroll taxes both go to the same place---the Federal Governments General Budget--the Big Pot o' Money that is spent on all things federally budgeted for. Social Security and Medicare taxes make a stop through their respective Trust Funds, but only for accounting purposes.

If we add this amount to the "negative" income tax  of  $637(refunded) mentioned at the top, then our sample household effectively has a tax rate of 15.2% ($7,478.70 minus $637.00  then divided by $45,000 X 100).

In this light, our household is certainly not a "47%-er" and net recipient/taker of tax dollars, but percent-wise, they are a major contributor. 

These federal taxes are not the only federal taxes paid by our household. There is the Federal gas tax, other excise taxes levied on a variety of goods we consume, and tariffs on imported goods. These other taxes are more difficult to see, but they should be considered in the over all discussion of tax policy, in my opinion.

Wednesday, November 28, 2012

See here how easy it is too have a pretty good paying job (teacher?) and be a member of the "47%" at the same time. Nice graphic and my explanation of why it is so...


It is rather easy, actually, given the aggregated tax policies enacted over time.

There are some basic deductions  that you are allowed to subtract from your total income. These deductions effectively reduce the amount of income that is actually subject to the income tax.  Deductions reduce your income subject to tax dollar for dollar.

Also...

There are some basic tax credits that you are allowed to subtract from your total tax bill.  Tax credits reduce your taxes owed dollar for dollar.  Notice the difference between a deduction and a tax credit.  This is important when discussing tax policy.

Both of these are dependent on whether you qualify for them. Some everybody is entitled to and some you get only if you meet certain criteria.

Deductions and tax credits are enacted to further some social, economic, or political goal. Individually,  they are supposed to serve as an incentive to bring about a desired outcome that benefits society.  Collectively, they could serve that purpose OR collectively create problems and/or inefficiencies. 

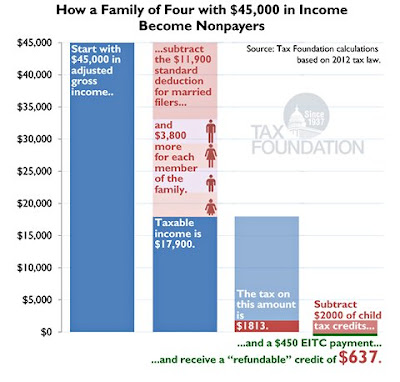
The following graphic illustrates how a person (or household in this case--a family of 4) earning $45,000 per year in income can owe no Federal Income Tax on that income by using the available income deductions and tax credits.
Source: The Economix

 This assumes the families total income from all sources (wages, interest earned on savings accounts, and "other") is $45,000.

This couples filing status is "Married, filing jointly" (I  assume) and includes both of their incomes combined OR it could be just one of them is the sole income earner.  It does not matter.

Right off the top, they are entitled to take a deduction of $11,900 for just being married. I will keep it at that and do another posting on how your tax bill will be affected by other potential filing statuses.  This deduction ("subsidy") serves to help reduce taxable income in an effort to help defray the cost of running a household with the goal of keeping families together and encourageing couples to stay married. That is/was the intent of the tax policy.

Next, the taxpayer can deduct from taxable income, $3,800 for each person in the household who is legally dependent on the taxpayer. Generally this means children, but it could be a parent, grandparent, or other dependent. You also INCLUDE yourself AND your spouse in the calculation.  This equals ($3,800 X 4)  $15,200.  See how you and your spouse were "double counted" in the calculation, first for being married then as a member of the household.  Assuming no other deductions you are allowed to take, the your income that is ACTUALLY subject to taxation is now ($45,000 - $11,900 - 15,200) $17,900.  This amount is called your "Taxable Income".  It is derived after taking all of your legally available income deductions.

The Federal Income tax owed on $17,900 is $1,813.  If we stopped right there this is how much the taxpayer would write a check to the IRS for ASSUMING they did NOT have any "Federal Withholding" from their paychecks throughout the year.  We will assume that for this exercise, but is likely they would have had some withheld.  Any withholding would off-set the amount of tax owed, either partially or totally.

This  taxpayer now finds they are entitled to a Child Tax Credit of $2,000 ($1,000 for each child). Taxpayers with an adjusted gross incomes of $110,000 or less are eligible for this credit, so this is not necessarily a "gift" to lower income people, however it benefits them a great deal.  Remember, tax credits reduce your taxes owed dollar for dollar.

Now, we subtract that $2,000 from our taxes owed of $1,813 and we now owe -$187.00 in taxes. Sweet!!  The Child Tax Credit is considered a "refundable tax credit" which means if the credit results in a negative number, the taxpayer owes $0.00 in taxes but they are entitled to the $187.00 too!

We are not done with our tax credits yet.  The next one is called the  "EITC", which stands for Earned Income Tax Credit.  This credit is targeted towards low income people--single, married, with or without children.  It is considered a significant anti-poverty policy and enjoys significant bi-partisan support in Congress and the Presidency.  The EITC is WAY TOO COMPLICATED to explain in a few sentences. Wikipedia has a pretty good summary of it here.

This family qualifies for this tax credit too, to the tune of $450.  Because this credit is 'refundable" as well, we subtract it from our tax bill, which currently is a negative $187.00.  So if you add this credit to the the total, this family will receive a tax REFUND check of $637.000. 

This family effectively pays no federal income tax on their $45,000 AND they get an extra $637 to consume or save.

This is certainly a form of income re-distribution BUT as I mentioned earlier, both of these tax credits in particular enjoy bi-partisan support, historically. 

So, now you know how someone earning $45,000 per year can have no tax liability and receive a refund check as well. 

This is a working person (could be a teacher with THAT salary) who would be considered a member of the 47%.  Working and has a good job,  but the net recipient of tax dollars.

Hope this helps with your understanding of the issue.

Thursday, August 30, 2012

Federal Budget spending in stacks of $10,000 bills sitting on pallets. See the three towers of political gridlock right here. Here's your sign...

The 3 pillars of the Federal Budget illustrated here--Social Security, Health Care (primarily Medicare and Medicaid) and National Defense. The rest is commentary, in my opinion.

The stacks are composed of individual pallets with packets of $10,000 bills. Each pallet holds $100,000,000 (100 Million dollars).

The fastest growing of these is Health care.  This is the reason this should be THE topic of discussion in the Presidential election, for better or worse.

More great visulazations like the HERE.

Source: DemocracyInfo

Friday, August 3, 2012

Entitlement Spending and Public Investment in 3 easy graphs. Hey, this is not a flashy subject but none more important...

The following sets of graphs illustrate the "Emperor has no clothes" in terms of the Federal Budget. Everyone knows the problem but no one does much about it.
Mandatory, or non-discretionary, Federal spending is concentrated in 3 major areas--Social Security, Medicare and Medicaid (and its subprograms). As illustrated in the first graph, these programs over time have steadily consumed a larger part of the Federal budget---approx. 47%!


Other parts of the budget consist of non-mandatory, or discretionary, spending.  Within this category you have "Investment Spending" by the Federal government. The following is a definition of Federal Investment from HERE:
"Federal investment is the portion of Federal spending intended to yield long-term benefits for the economy and the country. It promotes improved efficiency within Federal agencies, as well as growth in the national economy by increasing the overall stock of capital. Investment spending can take the form of direct Federal spending or of grants to State and local governments. It can be designated for physical capital, which creates a tangible asset that yields a stream of services over a period of years. It also can be for research and development, education, or training, all of which are intangible but still increase income in the future or provide other long-term benefits."
The graph below shows the decline over time of Federal Investment as a percentage of the Federal budget.  The implication is that there is significantly less funding for public works projects that confer benefits on everyone that the private market does not supply.


The last graph puts these two areas of the Federal budget together.  Budget dollars are not unlimited.  Over time, mandatory transfer payments to senior citizens and the poor have significantly surpassed non-mandatory public expenditures/investment in infrastructure. 

The Federal government does not do much of anything anymore in terms of physical public goods. They pretty much just write checks.  Think about that.

How do we address this issue? I dunno, I am just a high school economics teacher.  You will have to ask the Emperor and the Court Jesters we call the Executive and Legislative branches.

Sunday, July 31, 2011

Nice pie chart showing federal spending...Congress is focusing its appetite on the wrong side of the pie..

The lableling key to this chart starts with the darkest green slice at the top and goes clockwise. While not technically mandatory spending, all the green pieces of the pie would be considered politically mandatory items to fund in terms of prioritizing in the unlikely event the debt ceiling is not raised.  Excluding military payroll and VA benfits from the pie you can see our budget problem---interest on the national debt, Social Security and Medicare absorb 50% of the federal budget and it is rising.

Source: Business Insider

View My Stats