Saturday, June 30, 2012

"Obamacare" is now the law. See this map I put together that shows who will win the Presidency in November...

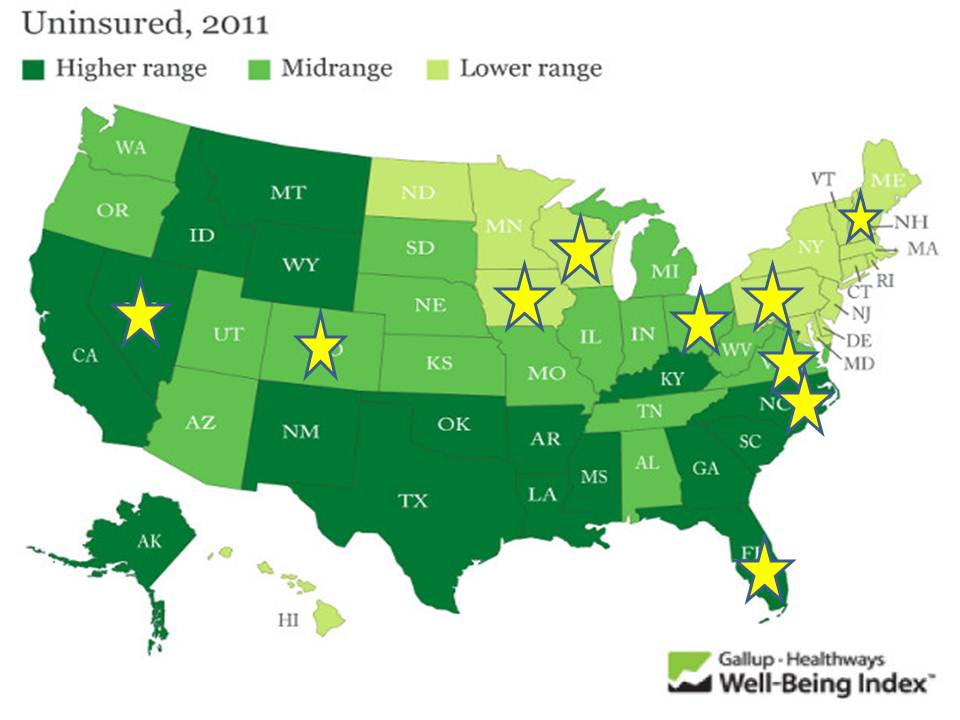
This map shows all the States and general level of the population without health insurance. I put a yellow star on the States that are considered Electoral College Toss Up States.

Look at the States that are Dark Green AND have a star on it---High Uninsured and a Toss-Up electorally---Alaska, Nevada, North Carolina and Florida.  Florida is the Big One with 29 Electoral College votes up for grabs---Advantage and Re-Election(?) for Pres Obama.  We elect Presidents through the Electoral College, not popular vote.  This matters!

Latest CBO (non-partisan govt office) revenue and cost estimate for the ACA ("ObamaCare"). "We are going to need a bigger Revenue Boat"...

This is the latest (March 2012) revenue and cost estimate for the now legal American HealthCare Act (ACA--aka--"ObamaCare").  CAUTION: notice the cost numbers are positive and the revenue numbers are negative here.  The bottom line number is "$1,252 Trillion" accumlated DEFICIT over the 11 year projection.  This is in ADDITION to any existing budge deficits occurring during this time span.

In other words, on average ($1,252T divided by 11), the Federal budget is going to require an additional $114 billion each year to pay for the ACA.  Again, this is over and above what the budget collects and spends currently on everything else.  This is a fact---I did not make up these numbers and they did not come a biased think tank. (Click on image to make larger)

Source: CBO Analysis March 2012
My educated guess is that this underestimates the costs and overestimates the revenues.  So the deficit in the program will likely be larger.  How much (?), no idea. Other than this has been the case for just about EVERY other sweeping program implemented in the last 20 years.  Am I wrong?

Given these numbers, where is the additonal revenue going to come from? Just askin'...

Thursday, June 28, 2012

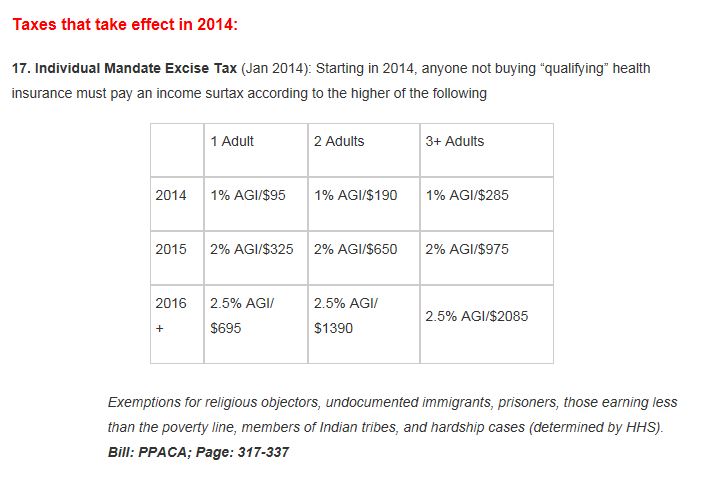
IF the Individual Mandate is upheld, here is a chart showing the Tax (or "fee") you will pay for not being insured...

If by some unexpected circumstance the Individual Mandate is declared Constitutional by the Supreme Court today, the chart below shows how the tax (or "Fee", I think it is actually called in the ACA bill) will play out for you.

Source: HERE
Example: If "1 Adult" in 2014 decided not to buy their own health insurance they would have to pay 1% of their Adjusted Gross Income (AGI--- your income that is taxed AFTER you take deductions from your actual ("Gross") income you earned in 2014).

Let's say for 2014 you calculate your AGI to be $15,000 (your gross income would actually be, perhaps, $17,000). One percent of $15,000 would be $150. That is higher than $95 (the minimum) so $150 would be your tax for forgoing the purchase of health insurance.  This is in ADDITION to any other Federal Income tax you may owe.

Notice in 2016 that percentage increases to 2.5%. Assume your income stays the same, then your tax would be 2.5% X $15,000 = $375. However, the minimum in 2016 is $695 so that is what you would pay instead of the $375.

It the purchase of insurance cost you more than the tax (or "Fee) then you are better off just paying the tax. It will be cheaper for you.

Wednesday, June 27, 2012

Dispatch from the Political Middle.

"We probably should pay more in Federal Taxes, but I think we already overpay for what we get in Federal Government". ---words of a fictional "Politically Middle Voter"(really, me)

A bit of a pardox.

I think for a lot (most?) of people in the political middle, or people who just don't have the time or bandwidth to pay close attention, this is a fairly accurate "macro" view of the discussion on whether to raise Federal taxes or not.

However, if you apply this sentiment to individual programs, on a "micro" level,  I think you get a different outcome.  For example insert key words above with ANY Federal progam and see how you feel about it.  Examples:

"We probably should pay more in Federal Taxes for National Defense, but I think we already overpay for what we get in National Security". 
"We probably should pay more in Federal Taxes for Social Security and Medicare, but I think we already overpay for what we get in Social Security and Medicare benefits"
"We probably should pay more in Federal Taxes for Income Support programs for low income people, but I think we already overpay for what we get in return for helping low income people."
"We probably should pay more in Federal Taxes to fund public employee pensions, but I think we already overpay for what we give in retirement benefits for public employees."
"We probably should pay more in Federal Taxes to fund vital infrastructure projects, but I think we already overpay for the infrastructure we currently have".
If you are an ideologue and have definitive opinions on these issues, then these are easy for you. But if you are in the "Middle" it is not necessarily so clear.

As I think of more and more individual Federal programs, I find it more difficult to square the two clauses of the phrase I constructed.  How about you? Help me out.

You can do this at the State and Local level as well---insert police, firemen, and teachers (Oh, My!!).

Refer back to the original sentence that started this posting.  I blame current and past (40 years)Legislative and Executive branches for our jaded view expressed in the second clause in the sentence.  I resent this because it forces me to ponder the first clause. 

Sunday, June 24, 2012

Terrific interactive of "What Kills Us" since 1900. Whether you are taking a class or interested in the topic of healthcare, you will find this helpful...

A great set of  charts and graphs related to "what kills us" over time.  Worth a look if you are interested in, or taking a class in  healthcare, demographics, sociology, history, etc.  Go HERE (New England Journal of Medicine) for a terrific interactive and look at this information from many different angles. 

Source: Business Insider

Friday, June 22, 2012

The Obama Gift Registry to raise funds---Does this mean "Julia" is getting married?

I thought this was from the minds of the people at The Onion, but it is real.  I found it funny and wonder when the "Gravy Bowl" lobbyists will be out in force. 

Gravy Bowls are a consumption expenditure and is that not what we are tying to jumpstart?

So, the campaign is asking people to forego current consumption ("Gravy Bowl Stimulus") so they can (1) take a tax deductable donation (a dreaded "Tax Expenditure") that only higher income people normally take, and (2) make a speculative investment that has a 50-50 chance (according to polls) of success at this time.

Does anyone else see the irony here?  (Not being political, just cynical)...
Source: BarackObama.com
Here is the link to the video of "Julia" I mentioned in the title. It is a presentation of how a fictitious person grew up with the help of government benefits/programs....

Nice graphic showing the connection between Education and Inter-generational income mobility. Get into school kids, any school!!

The US Dept of Treasury just published a paper (HERE) and it included this graphic.  I modified it a little to explain/illustrate specifically the effect education has on children from the lowest income brackets and how it promotes upward intergenerational income mobility.  If you read and understand what is in the boxes you can figure out what is going on in the other income quintiles as well.
Note: It should be "45%" in the box on the left.

Source for this posting; The Economix

Nice graphic showing world-wide energy consumption by source. You "Greenies" are going to pass out, so pull your bike over to the side of the road before looking...

This graph (HT: The Conversable Economist) shows world consumption of energy by source since 1986.  There is good news and bad news and good news and bad news.

Oil consumption has been relatively level even though population and economic growth in developing countries have increased (good news).  However, the consumption of coal has increased (bad news), most likely in response to the population and economic growth increase. Natural gas, a cleaner fossil fuel, has come on line lately (good news). 

Look closely at the Orange area. That is for "renewables"--wind, solar, etc.  Increasing, but still a very small part of the overall energy picture. 

Like it or not, we are going to be dependent on dirty fuels for a significantly long time. If our policies don't reflect that then we are going to be in an economic funk for a long time as well. 

Monday, June 18, 2012

If you are young and looking for a place to settle where the economy is likely to thrive in the future, you need to look at these rankings...

Where is the economy doing well now and potentially in the medium and long term?  The rankings below are enlightening.  Take note of the States that appear several times across the measure.  Those are the places to be.

""And here are the top 10 future boom states, with some awfully familiar names at the top. For this category, the authors looked at different types of job growth, the education level of each state’s young workforce (25-44 years old), the median income for a household of four adjusted for cost of living, as well as a few secondary data elements.""--Source: Economic Modeling Specialists International


Below are rankings of States by various measures of what would be called factors condusive to doing business/promoting commerce. 

Saturday, June 16, 2012

Nice video showing advancement in Robotics. How many jobs is this GOING to eliminate OR (gasp!) create?

Below is an awesome video (HT: Carpe Diem) illustrating an advancement in robotics and its potential application to everyday life---industrial and personal. What will be the effect on employment when this technology becomes routine in daily life? I see the potential for creating instances of "structural unemployment" in the marketplace---people losing jobs to machines that can perform the same tasks as a worker. It is easy to see the jobs that might be lost and other costs this technology might impose on society. However, what about the "unseen" benefits of this technology on society and even on employment? Extra credit for good answers.

Friday, June 15, 2012

A quick reference visual of Federal Govt spending. Another reminder of the failure of the political class and the public that enables them...

Easy reference visual that shows current Federal governement spending in the broad budget categories.  Healthcare (includes Medicare, Medicaid), Social Security, and Interest on the National Debt are areas of mandatory spending---must be carried out regardless, whether the govt has the money or not. Some would say that Defense should be in that category as well.  The "Safety Net" contains unemployment compensation, food assistance and other income support programs.  This is considered (for the most part) a Mandatory part of the budge too.

The Mandatory items mentioned above are the "biggies" in terms of serious budget issues, but are "smalls" in terms of political emphasis.  The powers that be are feasting on the "everything else" in the budget in which each item represents a tiny part of the whole. 
Source: Christian Science Monitor

Wednesday, June 13, 2012

Update to my graph on Federal Employment...See what those people were hired to do during the recession. Surprising results...

I did not want to appear flippant in my last post on Federal Employment suggesting that additional Federal employees added to the Federal payroll were "Zero Marginal Product" employees. 

Using Census data I found the general categories of  employment for Federal employees and the change in employment from December 2007 (start of recession) to March 2010 (the latest data available).  These numbers are for FULL-TIME employees. There are substantial numbers of part-time workers but I choose to leave those out for now.

In the far right column I calculated the change in employment for each category.  I put an asterisk next to the numbers that stuck out from the rest.


Observation: "Health and Hospitals" added a combined 43,000+ jobs and "National Defense/International Relations" added 72,000+.  Together these two categories account for 115,000 full-time positions, or 62% (est.) of the total jobs "created" in the Federal Govt during this time span. Were these areas in such deficit that they needed this type of "pumping up"?  I honestly don't know.

The relatively large number of new Federal "Police" is curious to me. I am no conspiracy theorist, so don't go there, please. 


How about your observations.  What do you see?

Tuesday, June 12, 2012

Fact: Federal Govt employment has increased 125,000 since Inaguration Day. Allegation: Federal spending has remained almost flat since Inaguration Day. Question: What are those 125,000 people doing? See graph here...

Below is a graph that measures the change in Federal employees (NOT counting Postal employees) since 2007 (Pre-Recession).  The gray area represents the the time span of the recession.  The vertical Red Line shows when Pres Obama took office (Jan 2009).

At Point "A"  when the Pres took office the number of Federal employees was 2.075 million.

The big spike in 2010 represents massive, temporary hiring to do the Constitutionally mandated Census that occurs every 10 years. Ignore this spike.

Point "B" represents the number of Federal employees, 2.2 million, in May 2012 (latest measure).

The difference between "A" and "B" is the increase in the number of Federal employees since the Pres took office. This number is approx. 125,000.

If you want to extend the timeline back a bit to the beginning of the recession (left edge of the gray area) you will see that Federal govt employment increased 100,000 from that point to Inauguration Day 2009.  The total change in Federal employees since the beginning of the recession is 225,000

Just ball-parking AVERAGE Federal employee TOTAL compensation (wages + benefits) of $80,000 that is an INCREASE in the Federal Payroll of at least $18 billion dollars each fiscal year

If government spending is relatively flat and there are 225,000 additional employees added to the payroll since 2008, my question is "What are these people doing?"--- More payroll  means less spending on programs those employees are hired to administer...I THINK that is a fair question, isn't it?

Tell me where I am going wrong. Thanks!
Nice graphics showing the change in prices in the last 30 years of foods we commonly purchase. Do you think it is more or less today?

Here are some quick to read graphics (ALL from NPR) that will give you "food for thought" when, well, you have thoughts for food. 

The first one compares the percentage of money the average household spent on the various major food categories in 1982 and 2012. Amazingly consistent EXCEPT for we spend 31% LESS on meats (driven by subsidies?) and slightly MORE  than 100% on processed foods/sweets (driven by technology?).


In regards to the category "Meats" this does not mean that we eat less meat. The next chart shows we can consume more of it because a broad range of meats are significantly  CHEAPER today relative to 1982 (Prices are adjusted for inflation).  The same can be said for many other food items as well.


Here is the same data in bar graph format.


Lots of foods considered healthy have become less expensive over time. However, they have to compete with the category "processed foods/sweets"---tastes good, more filling... 

I can tell you from personal experience, the latter category wins every time over the former.

Monday, June 11, 2012

Will Tacos be delivered by flying Drones in the near future? If so, I know who is ready to be the first delivery driver. He is a purrrfect fit for the job


Here is an idea that will probably never take-off, figuratively and literally---Tacos delivered by a flying drone (like the military uses to kill terrorists or patrol the border or....).  If is does work, I know who can be the first delivery driver---he even has his own built-in transportation (see video below)...

Tacocopter Aims To Deliver Tacos Using Unmanned Drone Helicopters
""It's an unmanned drone helicopter shooting a taco from space down at you and your colleagues during lunchtime!
The Internet is going wild for Tacocopter, perhaps the next great startup out of Silicon Valley, which boasts a business plan that combines four of the most prominent touchstones of modern America: tacos, helicopters, robots and laziness.
Indeed, the concept behind Tacocopter is very simple, and very American: You order tacos on your smartphone and also beam in your GPS location information. Your order -- and your location -- are transmitted to an unmanned drone helicopter (grounded, near the kitchen where the tacos are made), and the tacocopter is then sent out with your food to find you and deliver your tacos to wherever you're standing.
You pay online, so the tacos are simply dropped off at your feet by the drone helicopter, which then flies back to the restaurant to pick up its next order....""
View My Stats