Here is a link to a short article on the value of "scarcity" in business (and you can extend this to govt as well, in my opinion) and why we should embrace it. As is learned Day 1 in a basic economics course, scarcity is the over-arching theme in the study of economics---how we (individual, businesses, govts) go about allocating limited resources to satisfy unlimited wants.
Below is an excerpt. I encourage you to read the whole thing...
The Silver Lining to Scarcity: It Drives Innovation
..."How does innovation manage to flourish under such time and budget constraints? For one thing, as these examples demonstrate, scarcity forces focus. Instead of exploring every avenue, consulting every possible collaborator, and blindly pursuing established "innovation processes" because they once worked for someone else, we make tough decisions about where to apply our efforts. This means leaving things out and taking risks—two actions we avoid in times of abundance. In times of scarcity, innovation is less risky than stagnation, especially when it's pursued with focus, clear expectations, and a creative problem-solving approach.
Scarcity also gives us an excuse to get on with it. With limitless time and resources, it's always easy to ask for more tests and get more data. "We'd like to get going on this concept," we find ourselves saying, "but maybe we should run it by one more review committee." Everyone has an opinion, and in times of plenty, everyone wants to be involved. But this is exactly where our tendency to design by committee takes over. Scarcity gives us the freedom to say "It'd be nice to go over it again, but we simply don't have the time/money."
Most important, scarcity forces us to be genuinely creative. The branded environment project described above didn't have the resources to do a "proper" sales office, so the team had to start from scratch. Given enough time and money, any competent organization can emulate something that succeeded in the past. But when limited resources take the tried-and-true off the table, the only option is to come up with something new....""
Saturday, March 3, 2012
Thursday, March 1, 2012
"It's a Gas, It's a Gas, It's a Gas Gas Gas (Taxes)!"---Gas taxes and consumption from around the world...
Gas prices vary across countries and continents. Much of the difference is in the level of taxation. The chart below (From The Conversable Economist) shows, in US dollars, the amount levied on a gallon of gas in various developed countries.

There are many reasons why you might want to put high taxes on gasoline. Economic theory suggests if you tax something you get less of it or at least less consumption of it. The chart below shows the relationship between the gallons consumed per person (vertical axis) and the retail price of gasoline, taxes included (horizontal axis). The labels are flipped relative to the conventional Demand Curve. There seems to be a pretty tight relationship between price and quantity demanded!


There are many reasons why you might want to put high taxes on gasoline. Economic theory suggests if you tax something you get less of it or at least less consumption of it. The chart below shows the relationship between the gallons consumed per person (vertical axis) and the retail price of gasoline, taxes included (horizontal axis). The labels are flipped relative to the conventional Demand Curve. There seems to be a pretty tight relationship between price and quantity demanded!

Saturday, February 25, 2012
Abbott and Costello explain how we calculate the unemployment rate...
The following is from the blog of Greg Mankiw. The humor that is calculating the unemployment rate in the US.
Abbott and Costello explain unemployment
Thanks to U Chicago's Allen Sanderson for sending this along:
COSTELLO: I want to talk about the unemployment rate in America.
ABBOTT: Good "subject". Terrible "times". It's about 9%.
COSTELLO: That many people are out of work?
ABBOTT: No, that's 16%.
COSTELLO: You just said 9%.
ABBOTT: 9% Unemployed.
COSTELLO: Right 9% out of work.
ABBOTT: No, that's 16%.
COSTELLO: Okay, so it's 16% unemployed.
ABBOTT: No, that's 9%...
COSTELLO: WAIT A MINUTE. Is it 9% or 16%?
ABBOTT: 9% are unemployed. 16% are out of work.
COSTELLO: If you are out of work you are unemployed.
ABBOTT: No, you can't count the "Out of Work" as the unemployed. You have to look for work to be unemployed.
COSTELLO: But ... they are out of work!
ABBOTT: No, you miss my point.
COSTELLO: What point?
ABBOTT: Someone who doesn't look for work, can't be counted with those who look for work. It wouldn't be fair.
COSTELLO: To who?
ABBOTT: The unemployed.
COSTELLO: But they are ALL out of work.
ABBOTT: No, the unemployed are actively looking for work...Those who are out of work stopped looking. They gave up. And, if you give up, you are no longer in the ranks of the unemployed.
COSTELLO: So if you're off the unemployment roles, that would count as less unemployment?
ABBOTT: Unemployment would go down. Absolutely!
COSTELLO: The unemployment just goes down because you don't look for work?
ABBOTT: Absolutely it goes down. That's how you get to 9%. Otherwise it would be 16%. You don't want to read about 16% unemployment do ya?
COSTELLO: That would be frightening.
ABBOTT: Absolutely.
COSTELLO: Wait, I got a question for you. That means they're two ways to bring down the unemployment number?
ABBOTT: Two ways is correct.
COSTELLO: Unemployment can go down if someone gets a job?
ABBOTT: Correct.
COSTELLO: And unemployment can also go down if you stop looking for a job?
ABBOTT: Bingo.
COSTELLO: So there are two ways to bring unemployment down, and the easier of the two is to just stop looking for work.
ABBOTT: Now you're thinking like an economist.
COSTELLO: I don't even know what the hell I just said!
COSTELLO: I want to talk about the unemployment rate in America.
ABBOTT: Good "subject". Terrible "times". It's about 9%.
COSTELLO: That many people are out of work?
ABBOTT: No, that's 16%.
COSTELLO: You just said 9%.
ABBOTT: 9% Unemployed.
COSTELLO: Right 9% out of work.
ABBOTT: No, that's 16%.
COSTELLO: Okay, so it's 16% unemployed.
ABBOTT: No, that's 9%...
COSTELLO: WAIT A MINUTE. Is it 9% or 16%?
ABBOTT: 9% are unemployed. 16% are out of work.
COSTELLO: If you are out of work you are unemployed.
ABBOTT: No, you can't count the "Out of Work" as the unemployed. You have to look for work to be unemployed.
COSTELLO: But ... they are out of work!
ABBOTT: No, you miss my point.
COSTELLO: What point?
ABBOTT: Someone who doesn't look for work, can't be counted with those who look for work. It wouldn't be fair.
COSTELLO: To who?
ABBOTT: The unemployed.
COSTELLO: But they are ALL out of work.
ABBOTT: No, the unemployed are actively looking for work...Those who are out of work stopped looking. They gave up. And, if you give up, you are no longer in the ranks of the unemployed.
COSTELLO: So if you're off the unemployment roles, that would count as less unemployment?
ABBOTT: Unemployment would go down. Absolutely!
COSTELLO: The unemployment just goes down because you don't look for work?
ABBOTT: Absolutely it goes down. That's how you get to 9%. Otherwise it would be 16%. You don't want to read about 16% unemployment do ya?
COSTELLO: That would be frightening.
ABBOTT: Absolutely.
COSTELLO: Wait, I got a question for you. That means they're two ways to bring down the unemployment number?
ABBOTT: Two ways is correct.
COSTELLO: Unemployment can go down if someone gets a job?
ABBOTT: Correct.
COSTELLO: And unemployment can also go down if you stop looking for a job?
ABBOTT: Bingo.
COSTELLO: So there are two ways to bring unemployment down, and the easier of the two is to just stop looking for work.
ABBOTT: Now you're thinking like an economist.
COSTELLO: I don't even know what the hell I just said!
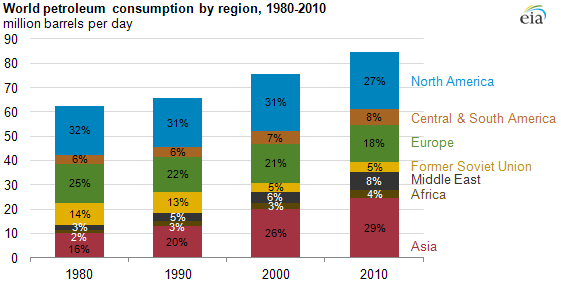
A couple of sobering charts showing the change in world oil consumption since 1980. Not a "barrel" of laughs...
A couple of sobering charts showing the change in world oil consumption since 1980.
The rise of Asia accounts for much of the overall net increase in consumption. The total consumption (demand) of oil worldwide has increased approx 37% (85 minus 62 divided by 62) in 30 years.
The rise of Asia accounts for much of the overall net increase in consumption. The total consumption (demand) of oil worldwide has increased approx 37% (85 minus 62 divided by 62) in 30 years.
 |
| Source: EIA |
 |
| Source: EIA |
Nice graph showing gas prices from 1918 (yes, that's right) in nominal terms and adjusted for inflation. Quite interesting!!
Here are 2 measures of gasoline prices dating from 1918. The black line is in nominal prices--just the price of a gallon of gas in a given years price (not adjusted for inflation).
The red line is adjusted for inflation over time. It is measured in 2011 prices. The year 1981 is noted on the graph. The nominal price in that year was $1.35/gal. In 2011 dollars that would be equivalent to $3.31/gal. In other words, what cost you $1.35 in 1981 would have cost you $3.31 in 2011.
The red line is adjusted for inflation over time. It is measured in 2011 prices. The year 1981 is noted on the graph. The nominal price in that year was $1.35/gal. In 2011 dollars that would be equivalent to $3.31/gal. In other words, what cost you $1.35 in 1981 would have cost you $3.31 in 2011.
 |
| Source: Inflationdata |
Friday, February 24, 2012

Sunday, February 19, 2012
Law just passed by Congress taxes at 100% Unemployment Benefits collected by people with incomes over $750,000 ($1.5M for a couple). Read that again. Yes, millionaires collecting unemployment benefits IS a problem! See the data here...
The following two graphics (source HERE) show the amount of Unemployment compensation collected by millionaires from 2005 to 2009. Really? I mean REALLY? I would love to know who those 18 with OVER $10 million in income for ONE YEAR are. Gee Whiz...

 |
| Source: Senator Tom Coburn |

Nice graph showing on a historical basis where tax dollars from all levels of government tend to flow. Guess first, then look at the graph...
This graph from the NYTIMES shows, on a per person basis, where tax dollars at all levels of government have flowed since 1960. Government is pretty much in the Public Transfer Payment business today. Everything else is just commentary.
 |
| Source: NYTIMES |
Nice chart showing the effective tax rates of the Top 400 Taxpayers and a very brief explanation of how this came to be...
From this chart, you can see the 400 taxpayers in the US (data from 2008) earn most of their income in what are called "Capital Gains" (56.8% --center chart) and a bulk of them pay an effective tax rate of between 10% and 20% (left chart). Below the chart I give a brief (albeit not comprehensive) explanation on how this works.
A Capital Gain (or loss--I am going to focus on Gain) is the difference between the buying price of a qualified investment (i.e. a stock) and the selling price. Really as simple as that. Here is the important point: The time span between the buying and selling is going to determine how much tax you pay on that gain.
If you buy it and sell it within the same year (365 days) you have to included it as regular income and the gain is taxed at the marginal tax rate (assume you are one of 400 above) of 35%.
If you sell it anytime after one year (365 days) the Capital Gain in not considered regular income and is taxed at 15%. What a difference a day makes!
Over time, as the richest 400 (and ones above that threshold) moved from being income earners to financial and physical asset holders their overall effective tax rate decreased as well. Look at the list of them HERE. You can see that many/most of them were prime earners/entrepreneurs in the 80's and 90's and built very valuable physical and financial assets. Mostly financial assets, though, in terms of the value of the stock in the companies they created.
Not saying I agree or disagree---it is just the way it has panned out...What do you think???
 |
| Source: NYTIMES |
If you buy it and sell it within the same year (365 days) you have to included it as regular income and the gain is taxed at the marginal tax rate (assume you are one of 400 above) of 35%.
If you sell it anytime after one year (365 days) the Capital Gain in not considered regular income and is taxed at 15%. What a difference a day makes!
Over time, as the richest 400 (and ones above that threshold) moved from being income earners to financial and physical asset holders their overall effective tax rate decreased as well. Look at the list of them HERE. You can see that many/most of them were prime earners/entrepreneurs in the 80's and 90's and built very valuable physical and financial assets. Mostly financial assets, though, in terms of the value of the stock in the companies they created.
Not saying I agree or disagree---it is just the way it has panned out...What do you think???
Saturday, February 18, 2012

Shop Online and Save a Barrel of Oil...E-Commerce helps solve Climate Change--The Unseen (positive) effects of Creative Destruction...
Shopping on the internet is still in its infant stages but it appears it has a disproportionate negative effect on some business/industries compared to others. A nice example of elasticities across industies and how they change over time.
As shown in the graph below, e-commerce has enjoyed high growth in a short period of time (Green line). Not to suggest correlation is causation, but if you look at the other two lines representing the other two categories of goods (Orange and Less Orange(?) line), and look at your own changing buying habits, I think the relationship is quite clear---online shopping is slowly destroying the "brick and mortar" (real physical stores) in some industries.
It also has a positive impact on the environment too:
As shown in the graph below, e-commerce has enjoyed high growth in a short period of time (Green line). Not to suggest correlation is causation, but if you look at the other two lines representing the other two categories of goods (Orange and Less Orange(?) line), and look at your own changing buying habits, I think the relationship is quite clear---online shopping is slowly destroying the "brick and mortar" (real physical stores) in some industries.
 |
| Source: Wall Street Journal |
"But there are still some brick-and-mortar retailers who have little to fear from the Internet. In the fourth quarter of 2011, gas stations represented 11% of all retail sales, up from 10% during the recession and 7% in 1999. Part of that is due to rising prices at the pump, but gas also is something you still have to go out to purchase.Of course, the more people can do from home the less use they will have for their cars. So maybe gas stations aren’t totally immune after all."" (source: WSJ)
Nice, short video of David Lee Roth (Van Halen) explaining why the band demanded M&M's for each concert but the brown ones had to be taken out. Selfish rock star or brilliant businessman? Hmmm....
A couple of things of interest here (besides how he is dressed).
David Lee Roth, former front man for Van Halen, explains why in their live concert contracts they demanded the band be provided with M&M's but there were to be NO brown ones in the bowls.
Spoiled, demanding rock stars OR a smart business strategy? The video is only 5 minutes long but informative. Now when I read other musicians/actors who have crazy requests that appear to be selfish in nature, I will think more closely as to why they are asking for them.
David Lee Roth, former front man for Van Halen, explains why in their live concert contracts they demanded the band be provided with M&M's but there were to be NO brown ones in the bowls.
Spoiled, demanding rock stars OR a smart business strategy? The video is only 5 minutes long but informative. Now when I read other musicians/actors who have crazy requests that appear to be selfish in nature, I will think more closely as to why they are asking for them.
Brown M&Ms from Van Halen on Vimeo.
Profiles of 11 Long Term Unemployed People---How do we solve this problem?
We JUST talked about this in class yesterday. The ranks of those classified as Long Term Unemployed are growing. How do we begin solving the problems of the long-term unemployed in the SHORT TERM? I believe this question is not as easy to answer as it is made out to be. Read the stories (very short) at the link below and tell me what you think.
The Truth About Long-Term Unemployment In America
Here is a graph showing illustrating the long term unemployment issue (Presence of "Discouraged Workers"):
This graph shows the number of workers unemployed for 27 weeks or more.
According to the BLS, there are 5.518 million workers who have been unemployed for more than 26 weeks and still want a job. This was down from 5.588 million in November. This is very high, but this is the lowest number since September 2009. Long term unemployment remains a serious problem.
The Truth About Long-Term Unemployment In America
Here is a graph showing illustrating the long term unemployment issue (Presence of "Discouraged Workers"):
 | |
|
According to the BLS, there are 5.518 million workers who have been unemployed for more than 26 weeks and still want a job. This was down from 5.588 million in November. This is very high, but this is the lowest number since September 2009. Long term unemployment remains a serious problem.
Tuesday, February 14, 2012
Why does a Salad cost more than a Big Mac? I am glad you asked---the answer within...
Here is an excellent example of how subsidies can distort markets. Subsidies tend to (1) lower the cost of production, hence more supply of a good and/or (2) lowers the price of the good for the consumer, hence more demand for a good. More supply, more demand, more market quantity. Notice I have not said anything about the societal value of the good in question.
Below is the US Dept of Agriculture's "Food Plate" replacement of the traditonal "food pyramid" many of us old-timers grew up learning. It is simply suggested serving sizes/portions of various foods that promote good health in the long run.
Below that is the proportion of subsidy money (read that tax money) that is provided mainly to suppliers of various agricultural products. Notice an imbalance? Fruits and Vegtables occupy approx half of the plate but receive a fraction of the subsidy money--Meat and Dairy occupy less than half but receive well over half the subsidy money. Grains are just about right (however, I wonder if that includes corn for ethanol subsidies)...

Remember, it is the SAME agency, The Dept of Agriculture that is responsible for BOTH of these programs!
Below is the US Dept of Agriculture's "Food Plate" replacement of the traditonal "food pyramid" many of us old-timers grew up learning. It is simply suggested serving sizes/portions of various foods that promote good health in the long run.
Below that is the proportion of subsidy money (read that tax money) that is provided mainly to suppliers of various agricultural products. Notice an imbalance? Fruits and Vegtables occupy approx half of the plate but receive a fraction of the subsidy money--Meat and Dairy occupy less than half but receive well over half the subsidy money. Grains are just about right (however, I wonder if that includes corn for ethanol subsidies)...
 |
| Source: PCRM |
Subscribe to:
Posts (Atom)
 View My Stats