Thursday, March 15, 2012

Robots and Bedpans---the hospital of the future is here now. More low-skilled jobs are about to be eliminated by technology.

Creative Destruction and its impact on jobs, especially low(er) skilled ones (not a good outlook) and higher skilled jobs (a good outlook), in the healthcare industry.  Out go the orderlies and in come the robots and hardward/software technicians.  Technology is changing everything and I am not sure we as a country fully understand the implications on the future of employment.

The Robots Are Coming to Hospitals:   A New Breed of Blue-Collar Robots is Handling the Dirty Work, Transporting Linens and Laundry


""Robots have already staked out a place in the health-care world—from surgical droids that can suture a wound better than the human hand to "nanobots" that can swim in the bloodstream.

But the stage is now set for a different kind of robots, one with a sophisticated brain and an unlimited tolerance for menial tasks.

In the next few years, thousands of "service robots" are expected to enter the health-care sector—picture R2D2 from "Star Wars" carrying a tray of medications or a load of laundry down hospital corridors.

Fewer than 1,000 of these blue-collar robots currently roam about hospitals, but those numbers are expected to grow quickly.

As America's elderly population grows, the country's health-care system is facing cost pressures and a shortage of doctors and nurses. Many administrators are hoping to foist some of the less glamorous work onto robots.

This could create a potential bonanza for software and application developers to write new programs for them, investors and industry watchers say...."" Rest of the story HERE

Wednesday, March 14, 2012

So THIS is how drug dealers "launder" their profits--- Tide laundry detergent is fast becoming a currency in the drug trade. Clever...

The laundry detergent Tide is fast becoming a form of currency in the illegal drug trade.  I wonder how long it will be before bottles of Tide are thrown into the air by rappers in You-Tube videos to show how much "currency" they have.
It’s a dirty job: Police nationwide take on soaring Tide detergent theft
""Law enforcement officials across the country are puzzled over a crime wave targeting an unlikely item: Tide laundry detergent.

Theft of Tide detergent has become so rampant that authorities from New York to Oregon are keeping tabs on the soap spree, and some cities are setting up special task forces to stop it. And retailers like CVS are taking special security precautions to lock down the liquid.

One Tide taker in West St. Paul, Minn., made off with $25,000 in the product over 15 months before he was busted last year.
“That was unique that he stole so much soap,” said West St. Paul Police Chief Bud Shaver. “The name brand is [all] Tide. Amazing, huh?”

Tide has become a form of currency on the streets. The retail price is steadily high — roughly $10 to $20 a bottle — and it’s a staple in households across socioeconomic classes.

Tide can go for $5 to $10 a bottle on the black market, authorities say. Enterprising laundry soap peddlers even resell bottles to stores.

“There’s no serial numbers and it’s impossible to track,” said Detective Larry Patterson of the Somerset, Ky., Police Department, where authorities have seen a huge spike in Tide theft. “It’s the item to steal.”
Why Tide and not, say, Wisk or All? Police say it’s simply because the Procter & Gamble detergent is the most popular and, with its Day-Glo orange logo, most recognizable of brands.
George Cohen, spokesman for Philadelphia-based Checkpoint Systems, which produces alarms being tested on Tide in CVS stores, said: “Name brands are easier to resell.
“In organized retail crimes they would love to steal the iPad. It’s very easy to sell. Harder to sell the unknown Korean brand."
Most thieves load carts with dozens of bottles, then dash out the door. Many have getaway cars waiting outside.
“These are criminals coming into the store to steal thousands of dollars of merchandise,” said Detective Harrison Sprague of the Prince George’s County, Md., Police Department, where Tide is known as “liquid gold” among officers.
He and other law enforcement officials across the country say Tide theft is connected to the drug trade. In fact, a recent drug sting turned up more Tide that cocaine.
“We sent in an informant to buy drugs. The dealer said, ‘I don’t have drugs, but I could sell you 15 bottles of Tide,’ ” Sprague told The Daily. “Upstairs in the drug dealer’s bedroom was about 14 bottles of Tide laundry soap. We think [users] are trading it for drugs.”

Police in Gresham, Ore., said most Tide theft is perpetrated by “users feeding their habit.”
“They’ll do it right in front of a cop car — buying heroin or methamphetamine with Tide,” said Detective Rick Blake of the Gresham Police Department. “We would see people walking down the road with six, seven bottles of Tide. They were so blatant about it.”
Robyn Cafasso, chief deputy district attorney in Colorado Springs, Colo., said the problem is nothing more than “organized shoplifting” and can be stopped. One method is to toughen punishments for recidivists.

“There’s this old-school thought that this is a shoplift, so it goes into the municipal system,” Cafasso said. “We’re starting to actually get more habitual offenders out of the municipal system and refile charges to make it a more serious offense.”

Cafasso agreed that there’s been a major upswing in Tide theft. “Everybody knows that liquid detergent Tide is an expensive item,” she said.
The pharmacy chain CVS is locking down Tide and other laundry detergents in certain parts of the country alongside flu medication and other commonly stolen items. Joe LaRocca, of the National Retail Federation, said: “It’s a game of cat and mouse. There’s a real balance that takes place between customer service — the product available on the shelf — and securing the merchandise.”
Officials at Tide are trying to keep their hands clean.

“We don’t have any insight as to why the phenomenon is happening, but it is certainly unfortunate,” said Sarah Pasquinucci, a spokeswoman for Procter & Gamble.""

Monday, March 12, 2012

More evidence that we need to see China as an opportunity rather than a problem...

I wish we could be more forward thinking when it comes to China andtheir economy.  Businesses are starting to reap the benefit of growing incomes there.  We cannot afford to not pay attention to 1.3 billion potential customers.  The protectionism is a losing proposition.  We can see China as a problem or an opportunity.  Even I know which is a better path.

I encourage you to read the full article.  If you are looking for a career with growth, connect with an international firm that wants to do business and not politics...

U.S. exports to China boom, despite trade tensions
'""While the U.S. trade deficit with China continues to soar, a surge in U.S. exports is emerging as a bright spot in the often-troubled trade ties between the world’s largest economy and its largest foreign creditor.
With a richer China showing a growing appetite for U.S. products, the flow of goods includes an increasing volume of American soybeans, cars, airplanes and medicine — and even garbage that can be mined for copper and aluminum. Overall, U.S. exports to China are up nearly 50 percent in value since 2008.
The surge is happening without much change in Chinese government policies and without much specific help from the Obama administration, which has a stated goal of doubling all U.S. exports globally by 2014. Instead, experts say, the main reason for the increase has been a booming China, where wealthier tastes include an increased appetite for meat — and hence for soybeans used as livestock feed....""

Sunday, March 11, 2012

"Cooking Oil Rustlers"---I wonder how that plays out in the prison population. Nice article on substitutes and how markets respond to price signals

When the price of one good increases it can increase the demand for a viable,  substitute good.  In economics we call these goods, well, substitutes.  Easy enough. 

It also helps to explain the "Substitute Effect" regarding the downward sloping nature of a demand curve:   In the case mentioned below, Crude Oil relative to Cooking Oil:  ""Higher Price: An increase in price (of Oil) causes a decrease in the relative prices of substitute goods (Cookiing Oil). Buyers are inclined to buy more of the other substitute goods (Cooking Oil) and less of this good (Oil). The result is a decrease in the quantity demanded (of Crude Oil)"" (Amosweb).

In other words, an increase in the price of oil we move upward and to the left on the oil demand curve--movement ALONG the Demand Curve.  Cooking oil becomes relatively cheaper compared to oil, so the quantity demanded for cooking oil at a given price increases compared to before the increase in the price of crude oil. Hence, the demand curve for cooking oil shifts to the right, indicating an increase in Demand for Cooking Oil.  Got it??

Rising gas prices create smoking-hot demand for cooking oil
""From California to Maine, thefts of used cooking oil are on the rise — driven by the rising price of oil that makes biofuels more cost competitive with fossil fuels. Like thieves who ransack foreclosed homes for copper wire, higher prices for used cooking oil can attract people with a hunger for crime as well as dinner.
The old cooking oil, which has been used for decades in the chemical and animal feed industries, is now a hot commodity, as biodiesel manufacturers fight for raw materials . Biodiesel is gaining in popularity as a transportation fuel. The largest consumers are fleet operators, including municipal buses and courier firms like FedEx.""

More info on "The Scam" that is Daylight Savings Time....Hate losing that hour!!

From the Washington Post...

Daylight saving time — still mostly a scam

1) Daylight saving time doesn’t save energy — quite the opposite. Back in World War I, when Germany, Russia, and England first adopted daylight saving, the idea was to conserve coal for the war effort. (The United States eventually followed suit in 1918.) If these countries could just stretch out the daylight during the summer, leaders reasoned, then people would use less electricity for lighting. Sounds sensible, right? The problem is that daylight saving no longer seems to be effective on this score.


Here’s a raft of studies on the subject. Most of them find that while households do use less lighting during daylight saving, thanks to the longer, brighter afternoons, they also end up cranking up the air conditioning more, which makes it either a wash or a net loser for energy use. A 2008 paper (pdf) by economists Matthew Kotchen and Laura Grant examined what happened in Indiana when, thanks to a change in state law, all counties suddenly had to shift to daylight saving. They concluded that daylight saving probably costs Indiana about $10.7 million to $14.5 million per year in higher electricity bills and increased coal pollution.

Meanwhile, daylight saving doesn’t seem to impact gasoline use and driving habits one way or the other. Back in 2005, Congress decided to extend daylight saving by four weeks, claiming it would reduce oil use by 1 percent. A subsequent review (pdf) in 2008 by the Department of Energy found that the legislation didn’t appear to have any effect on gasoline consumption at all.

2) Daylight saving time might increase traffic fatalities. There’s also some dispute about whether daylight saving time increases or decreases traffic accidents. On the one hand, the extra hour of sunshine in the afternoon means that more people are driving while it’s still light out. That makes the roads safer, according to a 1995 study (pdf) in the American Journal of Public Health. On the other hand, the sleep disruptions that occur when clocks are moved forward can increase the risk of traffic fatalities during the spring. Back in 1996, researcher Stanley Coren found that traffic accidents flare up in the spring, when we set our clocks forward and everybody’s tired, and drop again in the fall, when we set our clocks back and get an extra hour of sleep.

3) Daylight saving can be bad for your health. Again, some mixed results here. The extra sunlight is good for vitamin D synthesis. But the disruption in sleep patterns caused by setting your clock forward can actually kill people. Here’s the finding reported in a brand new study out of the University of Alabama in Birmingham: “The Monday and Tuesday after moving the clocks ahead one hour in March is associated with a 10 percent increase in the risk of having a heart attack,” says researcher Martin Young. And a 2009 study (pdf) in the Journal of Applied Psychology found that tired workers are at greater risk of workplace accidents.

4) Daylight saving has mixed effects on the economy. Retailers love the extra sunlight — it means that there are more customers around who are willing to go out and shop. The all-powerful golfing industry is also a big fan, apparently. On the other hand, daylight saving can cut into sales for movie theaters and reduce the audience for prime-time television — people go out and enjoy the evening air instead of staring at screens inside.

So there you have it. Daylight saving: It kills people, it seems to be an energy-loser, and it leads to a slight uptick in road accidents in early March. On the other hand . . . who doesn’t enjoy a little more Vitamin D?

Saturday, March 10, 2012

Why is a hospital room so expensive? Nice graph showing the decline in number of hospital beds since 1975...What has happened to the population since then? This ain't Rocket science...

The number of hospital beds in the US declined by 35% since 1975. 

The US population was 216,000 in 1975 and 305,000 in 2008. That is an INCREASE of 41% in population.

How do you ration out a declining number of beds to a rising number of customers/patients?  Price....An additional reason for rising healthcare costs?

Why the demand curve slopes downward AND do we REALLY throw away this much clothing? Maybe Will Johnson is RIGHT!!

This quote comes from an article on cotton production and how our demand for clothes made from cotton has, at the margin, "crowded out" the production of food commodities.  I liked the article  because it nicely illustrates the downward sloping nature of a Market Demand Curve, specifically the inverse relationship between Price and Quantity Demanded:

""...Since 1994, the consumer price of apparel, in real terms, has fallen by 39 percent..... In the mid-1990s, the average American bought 28 items of clothing a year. Today, we buy 59 items.


I was also intrigued by this:

"...We also throw away an average of 83 pounds of textiles per person, mostly discarded apparel, each year. That’s four times as much as we did in 1980, according to an EPA analysis of municipal waste streams [PDF]...."

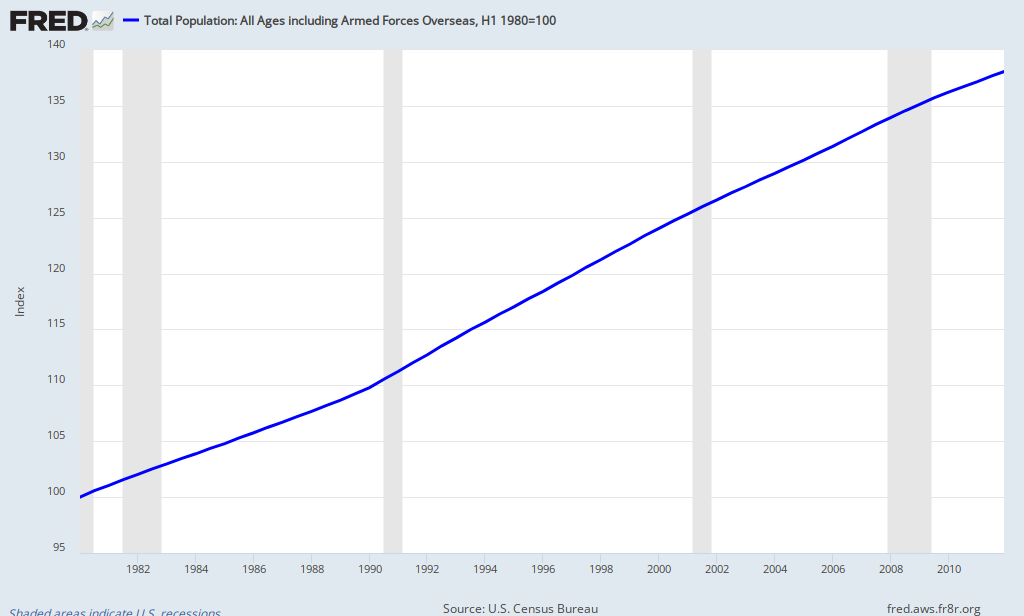
This since they quoted the statistic on a per person basis, I wondered how much the population has changed since 1980.   Here is the graph:
FRED Graph

Using an Index of 100 to represent the base year 1980, we can see the population has increased approximately 38% since 1980. Population increased 38% and we throw away 400% more.  I ain't no mathemetician, but that seems out of balance!  Reduce, Reuse, (Recycle??)...MAYBE Will Johnson has a point!!  :)

A couple of nice graphs showing a link between Capital Stock and Economic Growth---Hey, STOP yawning and find out why this is important!!!

Here are a couple of graphs that help illustrate an important concept in AP Macroeconomics---the relationship between "Capital Stock"(or Stock of Capital) and economic growth.  Capital Stock, simply, is "the stuff you use to make other stuff"--Tools/Equipment that produce goods/services but also help workers be more productive.  The assumption is as more Captial Stock is employed, in terms of quanitity and quality, the higher future economic growth will be (Actual and/or Potential Economic Growth).  
Source: Conversable Economist
The graphs from this study compare the use of capital in IT (Information Technology) by multinational corporations in the US and Europe (the top graph--Capital Employed-Per Labor Hour Worked) and the potential effect on overall productivity (the bottom graph--Output Per Labor Hour Worked) between the two geographical areas.

I inserted the Red Line at the year 2000 just to get a before and after perspective.  I did not post these to prove anything on a large scale. There are/could be many other variables affecting productivy between the continents.  However, I believe some of the difference in productivity gains can be attributed to a  higher level of Capital Stock employment and the effective use of that Capital in producing goods and/or services.

Saturday, March 3, 2012

Short article on the role of "scarcity" in business (and government). If you are a business, finance or econ student this will be helpful to you...

Here is a link to a short article on the value of "scarcity" in business (and you can extend this to govt as well, in my opinion) and why we should embrace it.  As is learned  Day 1 in a basic economics course, scarcity is the over-arching theme in the study of economics---how we (individual, businesses, govts) go about allocating limited resources to satisfy unlimited wants. 

Below is an excerpt. I encourage you to read the whole thing...

The Silver Lining to Scarcity: It Drives Innovation

..."How does innovation manage to flourish under such time and budget constraints? For one thing, as these examples demonstrate, scarcity forces focus. Instead of exploring every avenue, consulting every possible collaborator, and blindly pursuing established "innovation processes" because they once worked for someone else, we make tough decisions about where to apply our efforts. This means leaving things out and taking risks—two actions we avoid in times of abundance. In times of scarcity, innovation is less risky than stagnation, especially when it's pursued with focus, clear expectations, and a creative problem-solving approach.

Scarcity also gives us an excuse to get on with it. With limitless time and resources, it's always easy to ask for more tests and get more data. "We'd like to get going on this concept," we find ourselves saying, "but maybe we should run it by one more review committee." Everyone has an opinion, and in times of plenty, everyone wants to be involved. But this is exactly where our tendency to design by committee takes over. Scarcity gives us the freedom to say "It'd be nice to go over it again, but we simply don't have the time/money."

Most important, scarcity forces us to be genuinely creative. The branded environment project described above didn't have the resources to do a "proper" sales office, so the team had to start from scratch. Given enough time and money, any competent organization can emulate something that succeeded in the past. But when limited resources take the tried-and-true off the table, the only option is to come up with something new....""

Thursday, March 1, 2012

"It's a Gas, It's a Gas, It's a Gas Gas Gas (Taxes)!"---Gas taxes and consumption from around the world...

Gas prices vary across countries and continents. Much of the difference is in the level of taxation.  The chart below (From The Conversable Economist) shows, in US dollars, the amount levied on a gallon of gas in various developed countries.


There are many reasons why you might want to put high taxes on gasoline.  Economic theory suggests if you tax something you get less of it or at least less consumption of it.  The chart below shows the relationship between the gallons consumed per person (vertical axis) and the retail price of gasoline, taxes included (horizontal axis).   The labels are flipped relative to the conventional Demand Curve. There seems to be a pretty tight relationship between price and quantity demanded!

Saturday, February 25, 2012

Abbott and Costello explain how we calculate the unemployment rate...

The following is from the blog of Greg Mankiw. The humor that is calculating the unemployment rate in the US.


Abbott and Costello explain unemployment

Thanks to U Chicago's Allen Sanderson for sending this along:

COSTELLO: I want to talk about the unemployment rate in America.

ABBOTT: Good "subject". Terrible "times". It's about 9%.

COSTELLO: That many people are out of work?

ABBOTT: No, that's 16%.

COSTELLO: You just said 9%.

ABBOTT: 9% Unemployed.

COSTELLO: Right 9% out of work.

ABBOTT: No, that's 16%.

COSTELLO: Okay, so it's 16% unemployed.

ABBOTT: No, that's 9%...

COSTELLO: WAIT A MINUTE. Is it 9% or 16%?

ABBOTT: 9% are unemployed. 16% are out of work.

COSTELLO: If you are out of work you are unemployed.

ABBOTT: No, you can't count the "Out of Work" as the unemployed. You have to look for work to be unemployed.

COSTELLO: But ... they are out of work!

ABBOTT: No, you miss my point.

COSTELLO: What point?

ABBOTT: Someone who doesn't look for work, can't be counted with those who look for work. It wouldn't be fair.

COSTELLO: To who?

ABBOTT: The unemployed.

COSTELLO: But they are ALL out of work.

ABBOTT: No, the unemployed are actively looking for work...Those who are out of work stopped looking. They gave up. And, if you give up, you are no longer in the ranks of the unemployed.

COSTELLO: So if you're off the unemployment roles, that would count as less unemployment?

ABBOTT: Unemployment would go down. Absolutely!

COSTELLO: The unemployment just goes down because you don't look for work?

ABBOTT: Absolutely it goes down. That's how you get to 9%. Otherwise it would be 16%. You don't want to read about 16% unemployment do ya?

COSTELLO: That would be frightening.

ABBOTT: Absolutely.

COSTELLO: Wait, I got a question for you. That means they're two ways to bring down the unemployment number?

ABBOTT: Two ways is correct.

COSTELLO: Unemployment can go down if someone gets a job?

ABBOTT: Correct.

COSTELLO: And unemployment can also go down if you stop looking for a job?

ABBOTT: Bingo.

COSTELLO: So there are two ways to bring unemployment down, and the easier of the two is to just stop looking for work.

ABBOTT: Now you're thinking like an economist.

COSTELLO: I don't even know what the hell I just said!

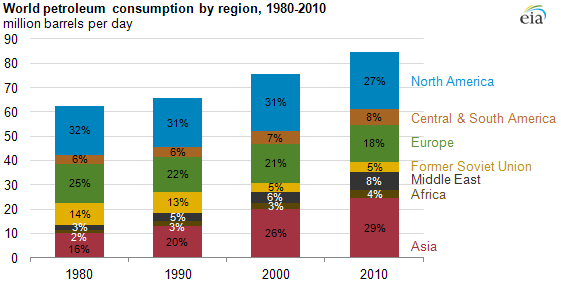
A couple of sobering charts showing the change in world oil consumption since 1980. Not a "barrel" of laughs...

A couple of sobering charts showing the change in world oil consumption since 1980. 

The rise of Asia accounts for much of the overall net increase in consumption.  The total consumption (demand) of oil worldwide has increased approx 37% (85 minus 62 divided by 62) in 30 years.

Source: EIA

Source: EIA

Nice graph showing gas prices from 1918 (yes, that's right) in nominal terms and adjusted for inflation. Quite interesting!!

Here are 2 measures of gasoline prices dating from 1918. The black line is in nominal prices--just the price of a gallon of gas in a given years price (not adjusted for inflation).

The red line is adjusted for inflation over time.  It is measured in 2011 prices. The year 1981 is noted on the graph. The nominal price in that year was $1.35/gal. In 2011 dollars that would be equivalent to $3.31/gal.  In other words, what cost you $1.35 in 1981 would have cost you $3.31 in 2011. 
Source: Inflationdata
View My Stats