Thursday, June 30, 2011

Number of the Week: U.S. Teachers’ Hours Among World’s Longest.

Source: Wall Street Journal

From WSJ: 1,097: Average number of hours U.S. teachers spend per year on instruction.

Students across the U.S. are enjoying or getting ready for summer vacation, but teachers may be looking forward to the break even more. American teachers are the most productive among major developed countries, according to Organization for Economic Cooperation and Development data from 2008 — the most recent available.

Among 27 member nations tracked by the OECD, U.S. primary-school educators spent 1,097 hours a year teaching despite only spending 36 weeks a year in the classroom — among the lowest among the countries tracked. That was more than 100 hours more than New Zealand, in second place at 985 hours, despite students in that country going to school for 39 weeks. The OECD average is 786 hours.

And that’s just the time teachers spend on instruction. Including hours teachers spend on work at home and outside the classroom, American primary-school educators spend 1,913 working in a year. According to data from the comparable year in a Labor Department survey, an average full-time employee works 1,932 hours a year spread out over 48 weeks (excluding two weeks vacation and federal holidays).

Since 1985 there are 50% fewer banks in the US making 350% more in loans*...Nothing can go wrong there, right?

The first graph below shows the change in the number of commerical  banks in the US since the mid-1980's.  I was quite surprised by the rapid decline in a relatively short period of time. Roughly a 50% drop. The slope is pretty steep considering it only represents 25 years.  Another interesting thing is that it appears recessions did not hasten the decline, which you might expect as some banks would fail--the decline just slides through the recessions like they never happened (post-2009 migth be the exception).  

Source: The New Arthurian Economics
 This next graph shows the growth in loans in Commericial/Industrial Loans (Business Loans for expansion, Capital Purchases, Accounts Receivables, etc), Real Estate (residential and commercial properties)  Loans and Loans to Consumers (Cars, Credit Cards, Student Loans, etc). Prior to 1985 banks were balanced in there portfolios of loans to these three sectors.  After 1985, there was a dramatic shift towards Real Estate loans.  Starting in the mid to late 1990's the Real Estate loan line (Red) becomes VERY steep and banks portfolios become very unbalanced (numerically and perhaps psychologically, too-- :) ).  

Source: The New Arthurian Economics
  What happened during the period between 1985 and the late 1990's that set in motion (1) the  decline in the number of banks and (2) the rapid increase in the number/value of loans made? Hmm...fewer banks making more loans...nothing bad can happen there, right?? Yes, Art, you can play along too and correct me as needed :)

*rough, ballpark calculation just by eyeballing--- 1985 about $1.7T and in 2011 about $6T..$6T/$1.7T = 3.529 x 100 = 353%

Bastiat's "The Seen and the Unseen" and "The Broken Window Fallacy" explained in a short video. Does it get any better than that?

Please go HERE for the text that accompanies this video. Only read the first part on "The Seen and the Unseen" and "The Broken Window Fallacy".

This is the first assignment I give in AP Economics (Both Macro and Micro). I like to thread the "seen" and "unseen" theme throughout the semeter. I think it underscores the concept of opportunity cost and helps students become better critical thinkers. I also find it is one concept students NEVER seem to forget!

HT: Kids Prefer Cheese

Nice Interactive---Compare the US to any other country in key demographic and "quality of life" measures..

If you go to this site, you can choose any country and compare them to the US (or you can use another country) in terms of a small sample of demographic and "quality of life" metrics.  Seems whenever I come across these type of things, the US always looks like one of the worst places on earth to live. Are these measures the "trees" but people are missing the "forest" that is the US? Still, it is interesting to see what are potential weaknesses are...One can always improve! :)

Source: If It Were My Home...

Wednesday, June 29, 2011

A nice set of Online Maps from National Geographic...A reminder of how fortunate we are just by virtue of where we are located on the planet...

A nice set of maps with lots of demographic and other information...Reminds me to appreciate my physical location on this planet a lot more. A minority of the population gets to enjoy the majority of the "good life". Go to National Geographic to seem the original maps and more information.


"It was the best of times, it was the worst of times"---Which one is it? Nice chart that shows we live in a golden age, although we probably don't realize it...

""I think I work hard. Lots of Americans think they work hard. But when you compare the economic situation of modern America with the rest of the world, or with long-ago history, then (in a phrase commonly attributed to the old football coach Barry Switzer) we're all born standing on third base, congratulating ourselves for hitting a triple."" (HT: The Conversable Economist)
The Industrial Revolution changed everything, it appears.  The dark blue bar is of interest to me. The light blue bar is a complement to the dark blue bar--they go hand in hand, in my opinion.  The entire output (production of goods and services) of the 1st through the 19th centuries does not even come close to the output of the 20th century by itself.  Even more stunning, is the output in a just 10 year old 21st century is already approx 42% of what was produced in the last century.  AND (HT: Carpe Diem) 23% of all production since 1 AD was produced in the period 2001-2010! Free (or freer) people  working within the framework of strong institutions (i.e. Rule of Law) that protect private property rights and individual liberty produce such results. You might say China is an exception.  In the short run, perhaps, but to sustain their economic gains they will (1) have to produce for people the characteristics I mentioned above, or (2) the people will demand them for themselves. 

Source: The Economist

Tuesday, June 28, 2011

Food for Thought on the Pay to Ride bus situation in KISD

Hello, My name is Gene Hayward. Full Disclosure: I teach Advanced Placement Economics at Central HS AND I do not live in the district, so take what I say with as many grains of salt as you like :) ...I would like to inject a thought into the Pay to Ride System, which in principle I support, but I do have a major concern that I do not think has been thought through. This should not be an area for conflict because it WILL have to be addressed in some fashion by everyone here…Here goes…According to the latest Texas Education Agency AEIS reporting system at http://ritter.tea.state.tx.us/cgi/sas/broker , in 2009-2010 school year KISD had 5,830 students classified at “Economically Disadvantaged”. Most of you probably did not know it was that high!! I was surprised myself. The Federal Govt. has used their criteria to determine this and school MUST allow students with this designation all the benefits of this designation. The district, to my knowledge, cannot means test any further to determine benefits (someone correct me it I am wrong). PLEASE keep that last point in mind, regardless of how you may personally feel about it. Those of us in the schools know that even though there may be a stigma attached to this label parents DO take advantage of the benefits accorded them. The pay for ride system will be no different. Let’s assume that only half take advantage of any help to pay for busing. This means 2,915 students will need roughly $300 per year (amount not set in stone yet—you are welcome to insert your own figure) for the bus. 2,915 X $300 = $874,500!! Can the community raise that amount? Can Durham subsidize that amount? Some combination thereof? Now, you can play with the 2,915 number—is it lower? Higher? I don’t know. BUT if we are approaching this as a business decision, would it not be appropriate to have some idea of the potential money needed and a plan to pay for this? I honestly don’t see where this amount is going to come from.

Now, I will point out a potential flaw in my own scenario---I will counter myself by assuming bus service is not a “right” as defined by education law, State or Federal. Someone can correct me on that. If it is not, then an administrative process has to be set up to means test potentially a couple of thousand of applications for financial assistance. Who is going to do this and how much would THAT cost?

What do y’all think? I respectively submit this for constructive criticism…Thank you!

That did not take long...The Tom Tom navigator has been effectively "Creatively Destroyed"..

The Tom Tom came to market in 2002 and the writing is on the wall (or LCD/LED screen) for its demise.  The "Smart Phone" is rapidly consolidating the sheer number of separate devices we currently use into one hand-held device.  I marvel at the changes I have seen in my lifetime (51 years), more specifically in the last 20 years. 

Smart Phones Sting Tom Tom
""Dutch navigation-system maker TomTom NV cut its sales forecast for the second time in two months, an indication that smartphones are eating into the market for standalone navigation devices more quickly than expected.

TomTom pointed to the crumbling North American market for personal-navigation devices, which it now expects will shrink by 30% this year.

Smartphone use, meanwhile, keeps growing. Some 72.5 million people in the U.S. owned smartphones as of the first three months of 2011, up 15% from the fourth quarter, according to market tracker comScore.

Increasingly powerful phones are disrupting the markets for a number of portable devices. Makers of videogame players, digital cameras and hand-held video recorders all are feeling some pressure. Hand-held GPS devices have become a particularly hard sell.""

Monday, June 27, 2011

"I want to ride my bicycle, because it creates jobs. I want to ride my bicycle because it is effective fiscal stimuluuuuss"-Yes, sung to the Queen song.

According to this research paper, infrastructure spending to support bicycle transportation trumps infrastructure spending on road projects in terms of jobs created per million dollars spent (11.4 jobs vs 7.8 jobs, respectively)...Do I have to wear the funny helmet?

HT: Andrew Sullivan

From the research abstract at PERI:

""Pedestrian and bicycling infrastructure such as sidewalks, bike lanes, and trails, can all be used for transportation, recreation, and fitness. These types of infrastructure have been shown to create many benefits for their users as well as the rest of the community. Some of these benefits are economic, such as increased revenues and jobs for local businesses, and some are non-economic benefits such as reduced congestion, better air quality, safer travel routes, and improved health outcomes. While other studies have examined the economic and non-economic impacts of the use of walking and cycling infrastructure, few have analyzed the employment that results from the design and construction of these projects. In this study we estimate the employment impacts of building and refurbishing transportation infrastructure for cyclists and pedestrians. We analyze various transportation projects and use state-specific data to estimate the number of jobs created within each state where the project is located.


The data for this study were gathered from departments of transportation and public works departments from 11 cities in the United States. Using detailed cost estimates on a variety of projects, we use an input-output model to study the direct, indirect, and induced employment that is created through the design, construction, and materials procurement of bicycle, pedestrian, and road infrastructure. We evaluate 58 separate projects and present the results by project, by city, and by category. Overall we find that bicycling infrastructure creates the most jobs for a given level of spending: For each $1 million, the cycling projects in this study create a total of 11.4 jobs within the state where the project is located. Pedestrian-only projects create an average of about 10 jobs per $1 million and multi-use trails create nearly as many, at 9.6 jobs per $1 million. Infrastructure that combines road construction with pedestrian and bicycle facilities creates slightly fewer jobs for the same amount of spending, and road-only projects create the least, with a total of 7.8 jobs per $1 million. On average, the 58 projects we studied create about 9 jobs per $1 million within their own states. If we add the spill-over employment that is created in other states through the supply chain, the employment impact rises by an average of 3 additional jobs per $1 million.""

Are you proud of your "Made in America" car/truck? Would that be ""Built Ford Tough" or "I Love What You Do For Me, Toyota"? Interesting comparison here...

Globalization in a nutshell...Your "Made in America" car or truck may very likely be made by a foreign company. In the graphic below, I put side by side cars.com analysis of the cars/trucks that are for sale in the US from 2006 and 2010.  They rank vehicles by where they are assembled and if they contain over 75% made in America sourced parts. There has been quite a re-shuffling of the deck in just 3 years.

I don't completely know the reason for this,  I will offer a semi-educated guess as to what maybe happening.  Japanese companies in the US are generally (if not at all) unionized, hence pay lower wages than US automakers. This means they can "affordably" buy US made parts--Jobs for assemblers AND for the workers in the industries making the parts. US automakers on the other hand, pay higher assembly wages, hence must cut costs by purchasing less expensive parts from foreign sources--- Jobs for assemblers in the US but not so much for workers in the industries making the parts. The net effect: On a per car basis which company is supporting more American jobs?

(HT: Carpe Diem--what would I do without this resource!)

From Cars.com---""What Are the Top American-Made Cars?


""Cars.com's American-Made Index rates vehicles built and bought in the U.S. Factors include sales, where the car's parts come from and whether the car is assembled in the U.S. We disqualify models with a domestic parts content rating below 75 percent, models built exclusively outside the U.S. or models soon to be discontinued without a U.S.-built successor. ""

Source: Cars.com


""Detroit's full-size pickups, once a dominant force on the AMI, remain off the chart. The F-150 held a commanding No. 1 spot in the first three years that Cars.com compiled the index, with domestic parts content as high as 90 percent. Alas, today's Michigan- and Missouri-built F-150 bears only 60 percent domestic content rating. Similarly, the Chevrolet Silverado, which held second place for much of the F-150's reign, has just 61 percent domestic content. Chrysler's Ram 1500 pickup's 70 percent domestic content fares better, but it still falls short of the AMI's 75-percent cutoff.""

Sunday, June 26, 2011

I have wasted money on some good or service, but I have never wasted money on money...Confused? Read this and you won't be confused but will be angry...

Wasting money on money. Who gets to say that? Well, some politicians and a bureaucratic structure that probably knew this was a bad idea but did not act, gets that distinction. I guess it is a stupid question to ask if anyone lost a job/election over this. Nice example of unintended consequences that really could have been avoided by resisting someone's pet project or idea.  Gee Whiz--please be better stewards of the peoples money...

Got this from Greg Mankiw:

""On today's Planet Money, we visit an underground vault that's full of money nobody wants.


The money — bags and bags of dollar coins — is the result of a 2005 law that requires the U.S. Mint to print a series of coins bearing the likeness of each U.S. president.

The problem is, people don't really like dollar coins. And there aren't enough people who are fired up about, say, Rutherford B. Hayes, to make much of a difference.

So more than 1 billion dollar coins are now sitting, unwanted, in Federal Reserve vaults around the country. By the time the program wraps up in 2016, the Fed will be sitting on 2 billion unwanted coins, according to the Fed's own estimates.

The total cost to manufacture those unwanted coins: $600 million.""

Saturday, June 25, 2011

Is re-paving a road "stimulative" to the economy? Compare these two photos. Are we using 1930's policies to solve 2011 problems?

Are "infrastructure projects" stimulating to the economy like they were during the Depression?  Are we using 1930's policies to solve 2011 problems? If the goal is to implement the use of machines/capital then we are doing the right thing. Road projects are a necessity, that is clear. But to justify them on the basis that they are, in large part, going to get our economy back on track and significantly lower unemployment seems a bit of a stretch to me.  If the goal of stimulus is to employ the masses, then, well, perhaps we should ask if "shovel-ready" is a literal or figurative term. More focus should be on the jobs of the future, not of the past...Just sayin'.

Repaving a road in Louisiana in the 1930's with a mix of labor and technology/capital...count the workers relative to capital...

Source HERE

Repaving a road today in Louisiana with today's mix of labor and technology...count the workers relative to capital

Source HERE
I assume the road in the bottom picture was done in a day or so and the road in the first picture took, well, I don't know how many days (weeks?)...

This "Summer" we need to "Fall" for the Arab "Spring" or it will be a dark "Winter" for seasons to come for us. The issue in one chart here...

Further evidence (for me) that the underlying reason for the "Arab Spring" movement in the Middle East can be explained in economic terms.  The chart below shows the rate of unemployment for young(er) people in select Middle Eastern countries relative to other parts of the world.  Below that are snapshots of most of the countries represented in the chart.  Focus just on the population pyramids in each one.

There is a toxic mix of a lack of economic opportunity AND a demographic balance tilted toward the very young.  Also, as noted here, "In contrast to most of the world, joblessness in many Middle Eastern countries tends to increase with schooling: the unemployment rate among those with college degrees exceeds 15 percent in Egypt, Jordan, and Tunisia."

Hmmm...lots of young, educated people with access to technology, diffuse knowledge of the "outside" world and a lack of opportunity domestically---Change in the region is inevitable--regardless of the despots actions today...   

Source: The Conversable Economist


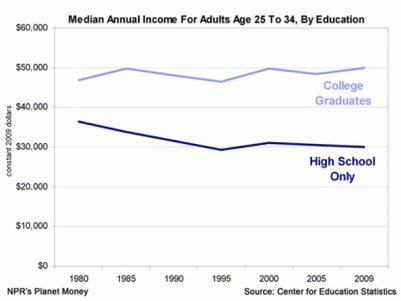
More evidence that you need to obtain Higher Education---see graph and explanation here

This graph shows the change in income over time between someone with a college degree vs a high school diploma. Notice on the tail end to the right that the lines start to move in opposite directions.  Before this time period they pretty much moved together (exception is between 1980 and 1985).  I want to emphasize that this does NOT mean that someone with solely a HS diploma will not succeed financially. These are moving averages. However, you will notice the decline in income for those with HS degree only. Also, This graph is not counting people with associate degrees or some other type of technical skills based education/training.  I would assume if you graphed the incomes of this class of people, the line would fall somewhere in between these two. 

Source: Business Insider
From all that I read in the business/economic literature, I believe this trend will continue. We are in the midst of a higher skills based economy, not only domestically but globally.  Like it or not, for most of us, it is a necessity to obtain, whether through college or other advanced educational institutions, and maintain the highest skill set we possibly can.  We may not like it, but that is simply the way it is.  We (maining you) gotta get on board with it...

Friday, June 24, 2011

Gas prices are too low and need to be higher! Our kids, grand-kids and great-grand kids will THANK US!

I am convinced the only way get off our dependence on oil (domestic and foreign) is to ensure the price of gasoline stays elevated.  A gas tax or a tax on a barrel of oil seems to be the preference of many/most economists.  $4.00 per gallon seems to be the generally accepted price that moves Americans to change their consumption behavior. It is a short term pain we must go through to obtain the long-term benefits.  Please read this short piece below.  I added emphasis on the parts I think are important.  You will see when the prices are high people start to make alternative choices in the types of vehicles they purchase.  The process works, it just has to be allowed to work itself through to the end.  The current policy to use the Strategic Oil Reserve only serves to slow down the process and sends mixed signals to the people. I am not insensitive to the hardships the high price of gas puts on people. I am MORE sensitive, however, to the hardships the will be visited upon the next generation if we don't take REAL action today. Is that so wrong? 

This is also a great read for AP Microeconomic teachers and students. Data is provided to calculate various elasticities...
Via Mark Thoma

From MIT Sloan Experts: My latest research* looks at how consumers adjust to high gas prices by changing the kinds of car they buy, and the prices they pay. What launched this research was the debate around the effectiveness of a gas tax to reduce climate change; the goal was to determine whether consumers undervalue fuel economy. If consumers do undervalue fuel economy, then such a tax would not shift enough consumers to buy smaller, more fuel-efficient automobiles.

I try to do my research with an eye toward showing policymakers what will happen if they adopt Policy X over Policy Y. I am not a granola environmentalist, but I do see a lot of inefficient policies out there, and as an economist that’s frustrating.

And here’s the thing…

At the moment, the US relies on a variety of subsidies and “performance standards” to reduce greenhouse gas emissions from the transportation sector. On the fuel side, we have ethanol subsidies and the Renewable Fuel Standard, which is an implicit subsidy program. On the vehicle side, we have Corporate Average Fuel Economy Standards, or CAFE standards, which dictate the average fuel economy of an automaker’s annual fleet. The current standard for passenger cars is 30.2 mpg. The standard for light-trucks — a classification that also includes SUVs under 8,500 pounds — is 24.1.

On the electricity side, lawmakers also use the Energy Star program, which was created in the early 1990s, to force appliance makers to create more efficient products. Policymakers seem to believe that consumers are not going to buy the correct dishwasher, or the correct air-conditioner. So instead, they regulate the manufacturer of these appliances to comply with certain efficiency requirements, rather than let the price of electricity reflect the social cost of that dishwasher or air-conditioner.

My research shows that performance standards – such as CAFE standards – may be more inefficient than previously thought, and that pricing instruments, such as a gas tax, would likely have a bigger impact on reducing greenhouse gas emissions.

My colleagues and I found that a jump in the price of gas causes a significant change in the kinds of cars that consumers buy and the price they pay for them. A $1 increase in the gasoline price changes the market shares of the most and least fuel-efficient new cars by +20% and -24%, respectively. Changes in gasoline prices also change the relative prices of the most fuel-efficient cars and the least fuel-efficient cars. For new cars, the relative price increase for fuel-efficient cars is $363 for a $1 increase in gas prices; for used cars it is $2839. (For comparison: a $1 increase in gas prices alters the budget of the average household by about $50 a month.)

I am not naïve, and I realize that no politician has ever been elected on a platform of: ‘I’m going to raise your gas prices,’ but by advocating alternatives, they’re promoting inefficient policies that simply hide these inflated costs. There’s a lot of resistance from consumers about the prospect of a gas or carbon tax, but I believe this is mainly because consumers are misled to believe that performance standards are cheaper.

The run-up in the price of gas in recent years has been substantial enough to make top auto executives give up their historic opposition to gasoline price taxes: some have even suggested that Congress should consider a variable gasoline tax that would create a $4 floor for retail gasoline prices.

Mike Jackson, CEO of AutoNation, the largest U.S. dealership chain, told the Wall Street Journal: “We need more expensive gasoline to change consumer behavior. Otherwise, Americans will continue to favor big vehicles, no matter what kind of fuel-economy standards the government imposes on automakers.”

Four dollars a gallon, he added, ‘is a good start.’ Hear, hear.
View My Stats