Tuesday, February 1, 2011

Enter your birth year and see how prices have changed compared to then---Man, I am OLD!!!

Go HERE to enter your birth year to see how much several staple items cost in your birth year compared to today...Not an exact measurement but interesting...


Source HERE
HT: Chartporn

I don't know what will happen in Egypt, but it might be worth re-reading key excerpts of The Declaration of Independence as a reminder...

These are self-selected excerpts from The Declaration of Independence that jump out at me when I read them and think about the change today in Eygpt and last week in Tunisia.  The parts in bold are my emphasis:

""When, in the course of human events, it becomes necessary for one people to dissolve the political bands which have connected them with another, and to assume among the powers of the earth, the separate and equal station to which the laws of nature and of nature's God entitle them, a decent respect to the opinions of mankind requires that they should declare the causes which impel them to the separation...""

""...whenever any form of government becomes destructive to these ends, it is the right of the people to alter or to abolish it, and to institute new government, laying its foundation on such principles and organizing its powers in such form, as to them shall seem most likely to effect their safety and happiness.""

""...But when a long train of abuses and usurpations, pursuing invariably the same object evinces a design to reduce them under absolute despotism, it is their right, it is their duty, to throw off such government, and to provide new guards for their future security...""

Video of a conversation with my wife today---Cabin Fever is setting in...

Do you have a sweet tooth? Find out why government policies and industry "rent-seeking" make it expensive for you to enjoy your vice...

Through a combination of Tariffs and Quotas, the supply of sugar coming from foreign sources to the US is less than what it would be without these market interventions.  The graph below shows the result of these policies on the price of sugar, domestically and internationally:
Source: Carpe Diem
You can see a significant difference between the World price and the USA price through time. Using a basic supply and demand graph,  we can analyze why this is so.

Let's just look at supply first. Below we have one supply curve for Domestic Supply  and one supply curve for Domestic Supply PLUS Imports.  At P* we see the Domestic Quantity Supplied is "QS1" (Point "A") and at P* we see the Domestic Quantity Supplied PLUS Imports is "QS2" (Point "B").


The amount of sugar imported at P* is QS2 minus QS1.  Now we must insert a Market Demand curve, "Demand*" that intersects "Supply 1 Domestic + Imports" at Point "B". This assumes NO tariffs or quotas on sugar. The market is relatively free to set the price world-wide. The price is re-labeled "Pworld".

Assume the worst case scenario--the Federal government imposes tariff and quotas to the point where NO sugar is imported into the US at all.  In the graph below we take away "S1 Domestic + Imports" curve from the graph above.  We are only left with the Domestic Supply curve "S*Domestic".


FREEZE!!! Assume the market does not immediately recognize what just happened and the market price STAYS at "Pworld". At "Pworld" the Domestic Quantity Supplied is "QS1" BUT the Quantity Demanded is still at "Qd1".  The Market QUANTITY SUPPLIED IS LESS THAN the Market QUANTITY DEMANDED. If we subtract QS1("A") from Qd1("B") we will find there is a SHORTAGE of sugar in the market:
How does a market solve a shortage? Look at the nice neat triangle formed between Points "A", "B", and a new Point "C".  The market inertia will be for the price to INCREASE.  The price increases and consumers DECREASE their quantity demanded at the higher price, move from Point "B" to Point "C" (Law of Demand) and suppliers INCREASE their quantity supplied at the higher price, move from Point "A" to Point "C" (Law of Supply).  Both sides of the market will MOVE ALONG there respective Demand and Supply curves until a new market equilibrium is achieved at Point "C":

At Point "C" we have a new domestic price for sugar, "Pdomestic" and a new market equilibrium "Q*":
The result is the US has LESS sugar at a HIGHER price. 

Using welfare analysis, consumers have lost some Consumer Surplus. This means consumers get to enjoy less sugar ("Qd1 minus Q*) at a lower price ("Pdomestic minus Pworld").  The graph below shows this area of lost Consumer Surplus:
Domestic producers of sugar gain some Producer Surplus--at a higher price, "Pdomestic minus Pworld", they increase their quantity supplied "Q*minus QS1". The area of additional Producer Surplus reaped by producers is shown in blue below:
However, the producer gain in surplus is actually a net loss for society.  The additional domestic resources, the difference between Q* and QS1, allocated to produce sugar could have been used for something else--OPPORTUNITY COST of producing sugar that we could have imported.  If we had imported readily available sugar from foreign sources, consumers (domestic producers of products that use sugar) could have consumed more sugar at a lower price AND domestic resources could have been freed up to produce something else. The area of Producer Surplus is the opportunity cost to society for not engaging in trade with the rest of the world.

On the other hand (famous Economist hedge)...MAYBE this is a GOOD thing overall!  Extra Credit on the next test if you can find the bright side to the policies of tariffs and quotas on sugar...

Sunday, January 30, 2011

Convenient chart on how much the average Egyptian spends on Food...You will hear more and more about the link between food and upheaval...

This is a chart of roughly how much the average Egyptian spends on needs and wants.  I assume this is typical of a citizen in a relatively low income country.  Food is a very large part of their budget and when prices increase it imposes a disproportionate burden on the family budget. 

Source HERE

Inflation in China reduces our trade deficit with them and brings jobs back to the US, right? I REALLY hope not!!

The other day in class I referred to Inflation as a thief in the night that takes money out of your pocket.  Not literally, but it does reduce the purchasing power of the money you possess, so you are in some measure being robbed.  It not only robs individuals, but whole countries. You might be surprised by which country, in my opinion, will be hurt the MOST by inflation in China---The US!

This article in the NYTIMES: Inflation in China May Curb U.S. Trade Deficit suggests that inflation in China will help reduce our trade deficit with them and that this might be a good thing. Yes, with higher prices for Chinese goods we will buy less (the Law of Demand) from them.

I. am. waiting. for. the. good. news...

This means the "stuff" we do buy from them, and will continue to buy from them, will be more expensive.

Inflation in China does not benefit us. It makes us pay more for staple items that meet our "needs" and we have less to buy things we "want". How is that a good thing?

Many of the consumer goods mentioned in the article produced in China are goods that are low tech in nature and have reached a routine manufacturing stage where it does not take a lot of skill or resources to produce them. THOSE JOBS ARE GONE FROM THE US AND WILL NOT COME BACK.  No amount of hand-wringing and politicking will change that.  Nor should we covet them.  Rather, we must invest in and prepare for the jobs of the future, not invest current resouces in trying to recover the jobs of the past.  I don't teach so you can re-gress. I teach so you can pro-gress.

More on Food Security and Toppling Governments---look for the underlying "trigger"---I propose we send in Matt Damon--He has the solution!!

I disagree with the "Malthusian" comparison in the article below but I agree with the underlying "trigger" for this potential domino effect of regimes falling across the Middle East---Food security.  You can always get young people in the streets to protest, well, most anything. But to get the bulk of the population, that just wants to stay under the the radar of the authorities, to go out and angrily demand change, then mess with the food supply and food prices. The article mentions other authoritarian governments purchasing additional grain supplies (which in turn will drive up the price and exacerbate the situation).  I suppose those countries should have focused on economic policies instead of creating police states  (See video below)---Do monarchs and dictators understand opportunity costs?? Rhetorical question...

The Guardian: Egypt and Tunisia usher in the new era of global food revolutions

""Political risk has returned with a vengeance. The first food revolutions of our Malthusian era have exposed the weak grip of authoritarian regimes in poor countries that import grain, whether in North Africa today or parts of Asia tomorrow.

The surge in global food prices since the summer – since Ben Bernanke signalled a fresh dollar blitz, as it happens – is not the underlying cause of Arab revolt, any more than bad harvests in 1788 were the cause of the French Revolution.

Yet they are the trigger, and have set off a vicious circle. Vulnerable governments are scrambling to lock up world supplies of grain while they can. Algeria bought 800,000 tonnes of wheat last week, and Indonesia has ordered 800,000 tonnes of rice, both greatly exceeding their normal pace of purchases. Saudi Arabia, Libya, and Bangladesh, are trying to secure extra grain supplies....""


Interested in Economics? This TED Talk by a Behavioral Economist is entertaining and shows how you merge economics with psychology...

Saturday, January 29, 2011

Where's the Beef? No, not from the old Wendy's commerical. I mean why are cattle disappearing?

WSJ: Smaller Herds Mean Pricier Beef
""The U.S. cattle herd has shrunk to levels not seen since 1958, a harbinger of higher beef prices.
The biannual inventory report released Friday by the U.S. Department of Agriculture puts the nation's herd at 92.582 million head as of Jan. 1. The supply of cattle in the U.S. has been falling steadily as feed costs rise, available pasture land shrinks and robust prices for young cattle provide a strong incentive for producers to cash out.
Prices for young cattle, known as "feeders" in the industry, also hit record highs recently, and analysts say such robust prices are helping to drive the ongoing declines in the U.S. herd. The immediate cash price for feeder cattle is too tempting to pass up, so producers opt to sell rather than keep young females for breeding, which can take two years before producing returns. Yet prices aren't likely to pull back until more young cattle are marked for breeding instead of being sold to feed lot operators to be fattened for beef.
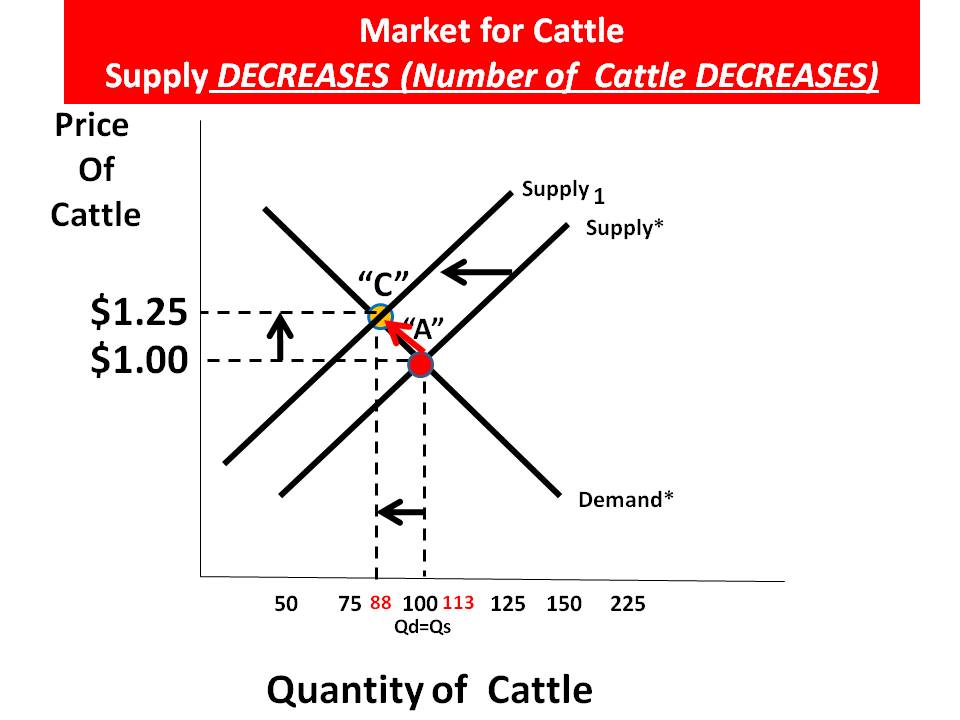
Two things are going on here to thin the herd of cattle in the US. One is the cost of feed (an input price) is increasing, hence that increases the cost of producing cattle. The other is a sell-off of "young feeders".  Let's look at the cost of feed first. Graphically, this is shown by the following (I use a fictitious price for cattle AND the increase in resource price--just reference prices and for simplicity):


The cost of feed for cattle has increased in price (that is another blog entry).  Assume it has increase by $.50. Now the cost to the rancher to raise 100 head of cattle is $1.00 plus $.50---$1.50:
What is true at 100 head of cattle is going to be the same at every price and quantity supplied combination
on Supply*--the cost is going to increase by $.50:
 
We now have a series of Price and Quantity Supplied combinations that lie to the left of Supply*.  Connect those points and we have a new supply curve, "Supply 1":
 
Since there is an increase in the price of cattle, driven on the supply-side, we move ALONG Demand*, up and to the left, to Point "D".  In other words, as the price increases ($1.25)  the quantity demanded decreases (75). This is what the Law of Demand suggests.  Note: The market price does not increase by the full $.50. Some is absorbed by the producer and some by the demander. How much each absorbs is dependent on their relative elasticities (a micro topic)
 
The second reason for a decrease in the supply of cattle is the selling of "feeder cattle", including females, for fattening instead of breeding. This simply will decrease the number of cattle available at every price. Graphically:
This one is a little easier to see. There will be, in absolute terms,  fewer (assume 25) cattle supplied ("quantity supplied) at every price:
We have a series of Price and Quantity Supplied combinations that lie to the left of Supply*. If you connect these points we have a new supply curve, "Supply 1".
We reach a new equilibrium price where quantity demanded = quantity supplied at $1.25. 
 
The combination of an increase in inputs costs and a thinning of the heard for an immediate pay-off will result in higher cattle prices, hence beef prices at the retail level.  Now, it will be up to the demand-side to make its move.  Are there viable substitutes for beef which will decrease the demand for beef as consumers chase after a cheaper source of meat? That is known as the "substitution effect"...We will save that for class....

Do not buy your next airline ticket until you read this article! If may save you money...

Buying an airline ticket has to be one of the most frustrating and mysterious purchases one can make. In economics it is best explained through Price Discrimination, segmenting customers according to their willingness to pay.  We have been lead to believe that purchasing in well in advance is the best way to get a lower fare. Turns out, it may actually be the DAY and TIME you purchase your ticket is the key to getting a "deal" rather than the time lag.

WSJ: Whatever You Do, Don't Buy an Airline Ticket On …
""Rick Seaney, chief executive of FareCompare.com, studied three years worth of airline prices and concluded that 3 p.m. Eastern time Tuesday was the best time to buy. "That's when the maximum number of cheapest seats are in the marketplace," he said.""

This graph shows the dip in prices to major destinations during mid-week. I hope this helps you plan your next trip!
Wall Street Journal

This is only one part of this article. Click below to read the rest...I learned alot and hopefully I will be a more  educated ticket buyer the next time I fly!

Creative Destruction by way of the Smartphone---I am in awe of technology and its potential

Being of "a certain age", I pause everytime I see something like this and think about how technology has changed in a relatively short period of time.  Look at your phone for second and be reminded of the "back story" reason for its existence. It is a simple device---now. But the road to its simplicity is paved with lots of reseach and development, trial and error, labor and other resources.  What used to take many separate devices (TV, radio, computer, telephone, etc) has been condensed down to something you can hold in your hand and store in your pocket. I am not sure if this has conserved resources or not in its totality, but it certainly seems to have been an efficient and desirable re-allocation of societal resources.  What do you think?  If you disagree, then you have to respond to me with a technology that is at least 40 years old.  Don't call me on my home phone--I don't have one!

HT: Carpe Diem

GDP is back to Pre-Recession Level!! Why has the unemployment rate not followed suit? Is a hiring binge around the corner?

The latest report on Gross Domestic Product (GDP) released on Friday shows the US economy is back to the pre-recession level of Real GDP.  See graph below.  However, the unemployment rate of 9.4%  has barely budged in sometime. We are producing the same amount of GDP with millions fewer workers in a span of 2-3 years.  Will there be an unleashing of hiring in the coming months? If demand for goods and services remains strong AND if the productivity per worker declines as a result of this increase in demand, then businesses will have to assess whether their current workers are over-worked to the point where it is counter productive to NOT hire additional workers to help with production. OR they will substitute capital (Technology) for labor and the road will remain difficult for workers at the margin. The beat goes on...

Source: Carpe Diem


Forget Egypt and Oil Prices---What is happening in the Ivory Coast is REALLY going to hurt you personally

Will there be a chocolate drought? World’s supply of sustainable cocoa could run out by 2014

""The world faces a chocolate ‘drought’ over the next few years, an expert warned yesterday.

Political unrest in the Ivory Coast, where 40 per cent of the world’s cocoa beans are grown, has ‘significantly’ depleted the number of certified fair trade cocoa farmers.

Many have fled the West ­African country, while fair trade training programmes have also come to a halt.

Fairtrade training programmes have ground to a halt because of the danger farmers face in rural areas.

The situation is already affecting chocolate manufacturers, who are facing the highest cocoa prices for over 30 years....""
Political turmoil far away continues to affect YOU at a personal level. Problems in the West African counrty Ivory Coast are wreaking havoc on the world's SUPPLY of cocoa beans. The Ivory Coast is a major supplier of fair-trade cocoa beans to chocolate producers who have committed to only buying certified fair-trade cocoa beans for their finished products. This is an easy one---no graph needed---Demand EXCEEDS Supply, so what happens to the price? Go buy your chocolate now...oh, wait, that increases demand (consumer expectations) and increases the price too---Dang it! You really CAN'T escape the laws of demand and supply...

Friday, January 28, 2011

Need a reason to personally fret about the situation in Egypt? Check gas prices in the next few days...

WSJ: Crude Jumps 4.3% on Egypt Protests

 ""Egypt produces roughly 673,000 barrels a day, according to the Joint Oil Data Initiative, a global oil database, ranking it 21st among the world's oil producers. Still, the country is home to two of the world's key energy supply routes: the Suez canal, a transit point for oil and fuel shipments from the Persian Gulf to the Western Hemisphere, and the 200-mile-long Sumed pipeline, an alternative transit route to the canal. About one million barrels of oil per day was shipped through each route in 2009, according to the U.S. Energy Information Administration.""


""The Suez Canal is located in Egypt, and connects the Red Sea and Gulf of Suez with the Mediterranean Sea, covering 120 miles. Petroleum (both crude oil and refined products) accounted for 16 percent of Suez cargos, measured by cargo tonnage, in 2009. An estimated 1.0 million bbl/d of crude oil and refined petroleum products flowed northbound through the Suez Canal to the Mediterranean Sea in 2009, while 0.8 million bbl/d travelled southbound into the Red Sea. This represents a decline from 2008, when 1.6 million bbl/d of oil transited northbound to Europe and other developed economies.""Source HERE

Chinese cotton farmers are with-holding cotton in hopes of getting a higher price---how does this affect the Supply Curve? Shift it or Move along it?

Timely---We are doing the basics of Demand and Supply right now in class.  In today's Wall Street Journal there is an article on Chinese farmers hoarding cotton in hopes of getting a higher price in the near future:

WSJ: Chinese Take a Cotton to Hoarding
""Yu Lianmin, a cotton farmer in Huji, China, harvested 6,600 pounds of cotton this year. Despite record cotton prices, he didn't sell any of it.

Instead, mounds of cotton are piled up in two empty rooms of Mr. Yu's home, and the homes of many of the farmers in his small township of Yujia, which is part of the bigger township of Huji in northern Shandong province, 220 miles southeast of Beijing. The farmers are holding out for higher prices, aiming to help overcome higher costs of labor and fertilizer, which are up about 20% in the past year.

"I think there's still hope for prices to go higher," he said....""
This affects the supply-side of the market.  One of the determinants of supply is "Producer Expectations". If the farmers have a reasonable expectation the price of cotton will be higher in the future they will with-hold some/all of that supply.  Graphically, it looks like this:


The quantity supplied at every price is LESS on Supply1 relative to Supply*.  The Supply curve shifts to the left, representing a decrease in Supply.  Now, these farmers are VERY small suppliers in a world-wide market for cotton so their with-holding of cotton would NOT increase the price as illustrated above. What they are hoping for is a continued INCREASE in Demand for Cotton world-wide (and domestically) which WILL tend to increase the price:


The farmers can then increase their QUANTITY SUPPLIED of Cotton (13 bushels) at the higher price (this will help the cotton market move ALONG the supply curve from Point "A" to Point "C").  Remember, they are not increasing their quantity supplied at a lower price, which would shift the whole supply curve to the right. A subtle but important difference.
View My Stats