Saturday, January 29, 2011

Where's the Beef? No, not from the old Wendy's commerical. I mean why are cattle disappearing?

WSJ: Smaller Herds Mean Pricier Beef
""The U.S. cattle herd has shrunk to levels not seen since 1958, a harbinger of higher beef prices.
The biannual inventory report released Friday by the U.S. Department of Agriculture puts the nation's herd at 92.582 million head as of Jan. 1. The supply of cattle in the U.S. has been falling steadily as feed costs rise, available pasture land shrinks and robust prices for young cattle provide a strong incentive for producers to cash out.
Prices for young cattle, known as "feeders" in the industry, also hit record highs recently, and analysts say such robust prices are helping to drive the ongoing declines in the U.S. herd. The immediate cash price for feeder cattle is too tempting to pass up, so producers opt to sell rather than keep young females for breeding, which can take two years before producing returns. Yet prices aren't likely to pull back until more young cattle are marked for breeding instead of being sold to feed lot operators to be fattened for beef.
Two things are going on here to thin the herd of cattle in the US. One is the cost of feed (an input price) is increasing, hence that increases the cost of producing cattle. The other is a sell-off of "young feeders".  Let's look at the cost of feed first. Graphically, this is shown by the following (I use a fictitious price for cattle AND the increase in resource price--just reference prices and for simplicity):


The cost of feed for cattle has increased in price (that is another blog entry).  Assume it has increase by $.50. Now the cost to the rancher to raise 100 head of cattle is $1.00 plus $.50---$1.50:
What is true at 100 head of cattle is going to be the same at every price and quantity supplied combination
on Supply*--the cost is going to increase by $.50:
 
We now have a series of Price and Quantity Supplied combinations that lie to the left of Supply*.  Connect those points and we have a new supply curve, "Supply 1":
 
Since there is an increase in the price of cattle, driven on the supply-side, we move ALONG Demand*, up and to the left, to Point "D".  In other words, as the price increases ($1.25)  the quantity demanded decreases (75). This is what the Law of Demand suggests.  Note: The market price does not increase by the full $.50. Some is absorbed by the producer and some by the demander. How much each absorbs is dependent on their relative elasticities (a micro topic)
 
The second reason for a decrease in the supply of cattle is the selling of "feeder cattle", including females, for fattening instead of breeding. This simply will decrease the number of cattle available at every price. Graphically:
This one is a little easier to see. There will be, in absolute terms,  fewer (assume 25) cattle supplied ("quantity supplied) at every price:
We have a series of Price and Quantity Supplied combinations that lie to the left of Supply*. If you connect these points we have a new supply curve, "Supply 1".
We reach a new equilibrium price where quantity demanded = quantity supplied at $1.25. 
 
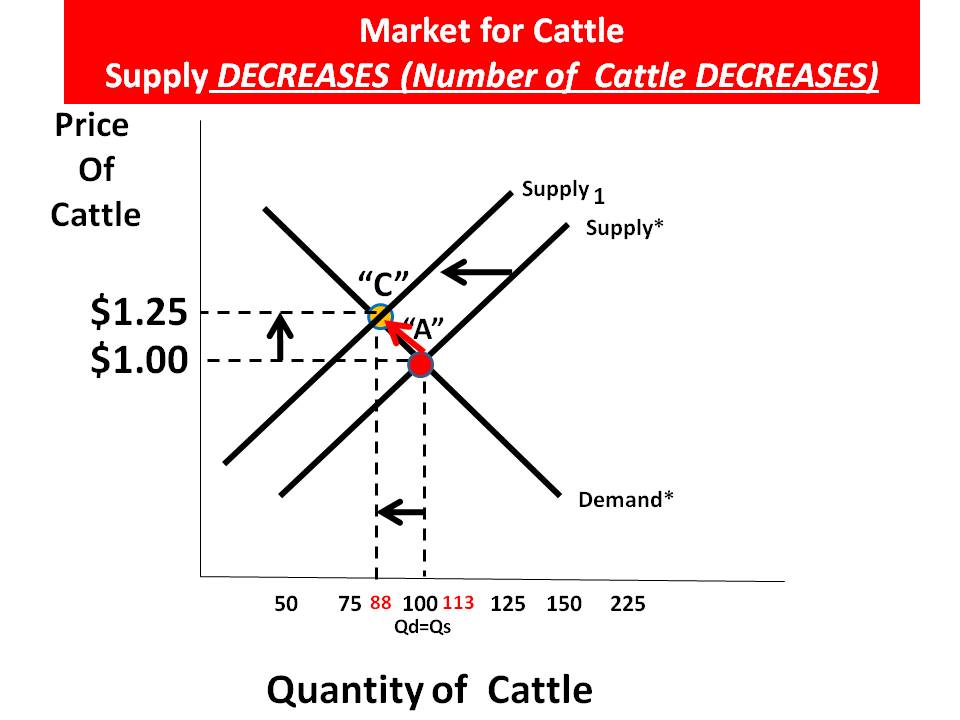
The combination of an increase in inputs costs and a thinning of the heard for an immediate pay-off will result in higher cattle prices, hence beef prices at the retail level.  Now, it will be up to the demand-side to make its move.  Are there viable substitutes for beef which will decrease the demand for beef as consumers chase after a cheaper source of meat? That is known as the "substitution effect"...We will save that for class....

Do not buy your next airline ticket until you read this article! If may save you money...

Buying an airline ticket has to be one of the most frustrating and mysterious purchases one can make. In economics it is best explained through Price Discrimination, segmenting customers according to their willingness to pay.  We have been lead to believe that purchasing in well in advance is the best way to get a lower fare. Turns out, it may actually be the DAY and TIME you purchase your ticket is the key to getting a "deal" rather than the time lag.

WSJ: Whatever You Do, Don't Buy an Airline Ticket On …
""Rick Seaney, chief executive of FareCompare.com, studied three years worth of airline prices and concluded that 3 p.m. Eastern time Tuesday was the best time to buy. "That's when the maximum number of cheapest seats are in the marketplace," he said.""

This graph shows the dip in prices to major destinations during mid-week. I hope this helps you plan your next trip!
Wall Street Journal

This is only one part of this article. Click below to read the rest...I learned alot and hopefully I will be a more  educated ticket buyer the next time I fly!

Creative Destruction by way of the Smartphone---I am in awe of technology and its potential

Being of "a certain age", I pause everytime I see something like this and think about how technology has changed in a relatively short period of time.  Look at your phone for second and be reminded of the "back story" reason for its existence. It is a simple device---now. But the road to its simplicity is paved with lots of reseach and development, trial and error, labor and other resources.  What used to take many separate devices (TV, radio, computer, telephone, etc) has been condensed down to something you can hold in your hand and store in your pocket. I am not sure if this has conserved resources or not in its totality, but it certainly seems to have been an efficient and desirable re-allocation of societal resources.  What do you think?  If you disagree, then you have to respond to me with a technology that is at least 40 years old.  Don't call me on my home phone--I don't have one!

HT: Carpe Diem

GDP is back to Pre-Recession Level!! Why has the unemployment rate not followed suit? Is a hiring binge around the corner?

The latest report on Gross Domestic Product (GDP) released on Friday shows the US economy is back to the pre-recession level of Real GDP.  See graph below.  However, the unemployment rate of 9.4%  has barely budged in sometime. We are producing the same amount of GDP with millions fewer workers in a span of 2-3 years.  Will there be an unleashing of hiring in the coming months? If demand for goods and services remains strong AND if the productivity per worker declines as a result of this increase in demand, then businesses will have to assess whether their current workers are over-worked to the point where it is counter productive to NOT hire additional workers to help with production. OR they will substitute capital (Technology) for labor and the road will remain difficult for workers at the margin. The beat goes on...

Source: Carpe Diem


Forget Egypt and Oil Prices---What is happening in the Ivory Coast is REALLY going to hurt you personally

Will there be a chocolate drought? World’s supply of sustainable cocoa could run out by 2014

""The world faces a chocolate ‘drought’ over the next few years, an expert warned yesterday.

Political unrest in the Ivory Coast, where 40 per cent of the world’s cocoa beans are grown, has ‘significantly’ depleted the number of certified fair trade cocoa farmers.

Many have fled the West ­African country, while fair trade training programmes have also come to a halt.

Fairtrade training programmes have ground to a halt because of the danger farmers face in rural areas.

The situation is already affecting chocolate manufacturers, who are facing the highest cocoa prices for over 30 years....""
Political turmoil far away continues to affect YOU at a personal level. Problems in the West African counrty Ivory Coast are wreaking havoc on the world's SUPPLY of cocoa beans. The Ivory Coast is a major supplier of fair-trade cocoa beans to chocolate producers who have committed to only buying certified fair-trade cocoa beans for their finished products. This is an easy one---no graph needed---Demand EXCEEDS Supply, so what happens to the price? Go buy your chocolate now...oh, wait, that increases demand (consumer expectations) and increases the price too---Dang it! You really CAN'T escape the laws of demand and supply...

Friday, January 28, 2011

Need a reason to personally fret about the situation in Egypt? Check gas prices in the next few days...

WSJ: Crude Jumps 4.3% on Egypt Protests

 ""Egypt produces roughly 673,000 barrels a day, according to the Joint Oil Data Initiative, a global oil database, ranking it 21st among the world's oil producers. Still, the country is home to two of the world's key energy supply routes: the Suez canal, a transit point for oil and fuel shipments from the Persian Gulf to the Western Hemisphere, and the 200-mile-long Sumed pipeline, an alternative transit route to the canal. About one million barrels of oil per day was shipped through each route in 2009, according to the U.S. Energy Information Administration.""


""The Suez Canal is located in Egypt, and connects the Red Sea and Gulf of Suez with the Mediterranean Sea, covering 120 miles. Petroleum (both crude oil and refined products) accounted for 16 percent of Suez cargos, measured by cargo tonnage, in 2009. An estimated 1.0 million bbl/d of crude oil and refined petroleum products flowed northbound through the Suez Canal to the Mediterranean Sea in 2009, while 0.8 million bbl/d travelled southbound into the Red Sea. This represents a decline from 2008, when 1.6 million bbl/d of oil transited northbound to Europe and other developed economies.""Source HERE

Chinese cotton farmers are with-holding cotton in hopes of getting a higher price---how does this affect the Supply Curve? Shift it or Move along it?

Timely---We are doing the basics of Demand and Supply right now in class.  In today's Wall Street Journal there is an article on Chinese farmers hoarding cotton in hopes of getting a higher price in the near future:

WSJ: Chinese Take a Cotton to Hoarding
""Yu Lianmin, a cotton farmer in Huji, China, harvested 6,600 pounds of cotton this year. Despite record cotton prices, he didn't sell any of it.

Instead, mounds of cotton are piled up in two empty rooms of Mr. Yu's home, and the homes of many of the farmers in his small township of Yujia, which is part of the bigger township of Huji in northern Shandong province, 220 miles southeast of Beijing. The farmers are holding out for higher prices, aiming to help overcome higher costs of labor and fertilizer, which are up about 20% in the past year.

"I think there's still hope for prices to go higher," he said....""
This affects the supply-side of the market.  One of the determinants of supply is "Producer Expectations". If the farmers have a reasonable expectation the price of cotton will be higher in the future they will with-hold some/all of that supply.  Graphically, it looks like this:


The quantity supplied at every price is LESS on Supply1 relative to Supply*.  The Supply curve shifts to the left, representing a decrease in Supply.  Now, these farmers are VERY small suppliers in a world-wide market for cotton so their with-holding of cotton would NOT increase the price as illustrated above. What they are hoping for is a continued INCREASE in Demand for Cotton world-wide (and domestically) which WILL tend to increase the price:


The farmers can then increase their QUANTITY SUPPLIED of Cotton (13 bushels) at the higher price (this will help the cotton market move ALONG the supply curve from Point "A" to Point "C").  Remember, they are not increasing their quantity supplied at a lower price, which would shift the whole supply curve to the right. A subtle but important difference.

Thursday, January 27, 2011

Ho Hum...Budget deficit for the year reaches $1.5 Trillion...Hmmm...What does that look like?

CBO projects U.S. budget deficit to reach $1.5 trillion in 2011, highest ever
This graphic shows what One Trillion Dollars looks like. To put the budget deficit for ONE YEAR in perspective, below you are looking at standard pallets stacked with $10,000 packs of $100 bills. Notice the average size man in the lower left-hand corner.  The pallets are double stacked and the whole thing is about the size of a Walmart Store.  Of course you have to add on half again to get $1.5 Trillion...Have a nice day...


Source HERE

Pictures of Shanghai China in 1990 and 2010...Really? Only 20 years?...AMAZING!!


Source HERE
If there are any visitors to this blog from China or are familiar with Shanghai enough to confirm this is what the city looks like now compared to 1990 I would appreciate it. I am doubting myself as to the veracity of the photos...THANKS!

Actual vs Potential GDP Graph---We need to consume us some GDP---FAST!

A close up view of the difference between the US's ACTUAL GDP and its POTENTIAL to produce GDP.  The line below the Potential GDP would represent the dollar figure for a point inside the Production Possibilities Frontier, such as Point "A".  The PPF just shows the raw production numbers of Capital and Consumer Goods.  We have a lot of ground to make up!

Source: Econbrowser


Why do people riot and rebel? Freedom? Liberty? It is more simple than that---INFLATION!

The latest evidence that most civil unrest, today and in history, is caused by the fundemental economic problem of scarcity...Rising food prices disproportionately hurt the very poor in developing countries.  They can suffer "a long train of abuses" (Declaration of Independence) but the tipping point for the masses is when food prices and availability become a problem. People normally not disposed to take to the streets to protest/riot will do so in this case.  Inflation is a thief that is not tolerated for long periods of time.

WSJ: Rising Price Pressures Spur Concerns
""With the risks of a double-dip recession apparently receding in most parts of the world, another economic challenge is emerging: inflation.


Rising prices for food, energy and other commodities are reducing the disposable incomes of poor people across the planet, providing a trigger for street protests in North Africa and posing a deep conundrum for policy makers world-wide.

In poorer countries, the disadvantages are more evident. In Tunisia, Algeria and Egypt, rises in food prices—such as a 30% increase in cooking oil in Algeria—have sparked street protests. Rising food prices heighten financial pressures on governments in the region because they are often direct buyers of commodities such as wheat, sugar and coffee, and they subsidize prices, said Francis Ghilès, a senior research fellow at the CIDOB Foundation in Barcelona.


In India, the chief executives of some of the country's largest companies cited rising food prices as a problem because they hurt the poorer sections of India's population and could translate into political uncertainty.


"Inflation is really our key priority...it's top of the government's priority," said Azim Premji, chairman of one of India's largest technology companies Wipro Ltd. He said he hoped that government support programs for the poor would help unrest from growing in the country's rural population. ""

Wednesday, January 26, 2011

Timely editorial on Comparative Advantage, which we just covered in class...

In class yesterday and today we covered the topics of Absolute and Comparative Advantage.  Below is an excerpt from an editorial in today's Wall Street Journal.  It is probably one of the most difficult economic concepts to really understand intuitively. Click HERE to get a better explanation than I could possibly give. Click HERE for my instructional video on doing the math for Absolute and Comparative Advantage.  Ignore my annoying mannerisms and focus on what I say and demonstrate.  It is tested on BOTH the AP Microeconomics and Macroeconomics test.

WSJ: Comparative Advantage and American Jobs: U.S. workers win when industries are free to invest where they are the most productive
""The key insight of the principle of comparative advantage, which drives much of globalization and its economic benefits, is that hard-working Americans are not going to excel at everything. That's okay, just as it's okay that Phil Mickelson is better off on the golf course and not painting his own house.


Comparative advantage allows each country to concentrate its energies on the particular goods and services that it is relatively productive at compared to the rest of the world. The countries then export those abroad, and in exchange import other goods and services produced relatively more efficiently abroad.""

Tuesday, January 25, 2011

The Presidents State of the Union Address and how it relates to the Production Possibilities Frontier---I told you I could do it!!

Here is how some of Pres. Obama's statements relate to the Production Possibilities Frontier.  I highlighted the key "buzzwords" I asked students to look out for.  All suggest an Allocative Efficiency decision to allocate more resources towards "Capital Formation"--moving to the production/development of more Capital/Infrastructure to create the conditions for true economic growth. On the graph below, we first have to move from Point "A" to Point "B" on the PPF (There is no such thing as a free lunch--Opportunity Costs!), before we can experience economic growth, illustrated by a shift to the right of the PPF. Economic growth is an increase in our potential to produce more goods (and services), both Capital and Consumer Goods.  Currently we are operating BELOW our potential, at a point inside our PPF.  It is important to remember the distinction between GDP growth, which is what we need to just get back to the PPF, and Economic growth, which I just described above as a shift to the right, or an increase, in our productive capacity.

""Meanwhile, nations like China and India realized that with some changes of their own, they could compete in this new world. And so they started educating their children earlier and longer, with greater emphasis on math and science. They’re investing in research and new technologies. Just recently, China became home to the world’s largest private solar research facility, and the world’s fastest computer.""


We know what it takes to compete for the jobs and industries of our time. We need to out-innovate, out-educate, and out-build the rest of the world.

But after investing in better research and education, we didn’t just surpass the Soviets; we unleashed a wave of innovation that created new industries and millions of new jobs.


We’ll invest in biomedical research, information technology, and especially clean energy technology – an investment that will strengthen our security, protect our planet, and create countless new jobs for our people.


Maintaining our leadership in research and technology is crucial to America’s success. But if we want to win the future – if we want innovation to produce jobs in America and not overseas – then we also have to win the race to educate our kids.


Our infrastructure used to be the best – but our lead has slipped. South Korean homes now have greater internet access than we do. Countries in Europe and Russia invest more in their roads and railways than we do. China is building faster trains and newer airports. Meanwhile, when our own engineers graded our nation’s infrastructure, they gave us a “D.”

We have to do better. America is the nation that built the transcontinental railroad, brought electricity to rural communities, and constructed the interstate highway system. The jobs created by these projects didn’t just come from laying down tracks or pavement. They came from businesses that opened near a town’s new train station or the new off-ramp.

 
Over the last two years, we have begun rebuilding for the 21st century, a project that has meant thousands of good jobs for the hard-hit construction industry. Tonight, I’m proposing that we redouble these efforts.

We will put more Americans to work repairing crumbling roads and bridges. We will make sure this is fully paid for, attract private investment, and pick projects based on what’s best for the economy, not politicians.

Within 25 years, our goal is to give 80% of Americans access to high-speed rail, which could allow you go places in half the time it takes to travel by car. For some trips, it will be faster than flying – without the pat-down. As we speak, routes in California and the Midwest are already underway.

All these investments – in innovation, education, and infrastructure – will make America a better place to do business and create jobs. But to help our companies compete, we also have to knock down barriers that stand in the way of their success.


To reduce barriers to growth and investment, I’ve ordered a review of government regulations. When we find rules that put an unnecessary burden on businesses, we will fix them.

Oldie but goodie video---SNL Skit "Don't Buy Stuff You Can't Afford"---May be good advice for Congress...

There is hope that going forward US aid to developing countries will, well, actually help them develop...See how within...

The manner in which the US conducts and administers foreign aid is open to lots of criticism.  I believe some good has come from it over time, but at great cost. I am 100% for helping poor countries get a leg up and start on the road to economic development, but the approach for the last 50 years has be relatively ineffective.  NOW there is hope if the new person in charge of the United States Agency for International Development (USAID) can change the bureaucratic inertia and out-moded thinking that drives US aid right now. See the article below for  some of the bolder statements made by the new Administrator. I highlighted the paragraphs I like the most and strike at the heart of what is needed to effectively help poor countries.  It is imperative that all aid efforts be as local as possible, from the resources used to the people responsible for a programs success.  We cannot transplant sustained economic growth, it has to be homegrown and nurtured.  This seems intuitive, but it is not the way aid has been carried out in the last 50 years.  It remains to be seen if he can do it, but I like the attitude. Those of you interested in a career in international development will want to read the article in full. (HT: Barbara Pierce)

Washington Post: New administrator wants to change the way USAID works

"This agency is no longer satisfied with writing big checks to big contractors and calling it development."

"There's always another high-priced consultant that must take another flight to another conference or lead another training," he said. "This practice simply must end." The declaration drew applause from the Center for Global Development audience...."

""He said reform of USAID contracting will mean accelerated "funding to local [non-governmental organizations] and local entrepreneurs, change agents who have the cultural knowledge and in-country expertise to ensure assistance leads to real local institutions and lasting, durable growth."

""Instead of going completely with U.S. or other contractors who could put up all the needed housing immediately, Shah sent procurement-reform teams to Haiti to work with local construction companies. He admitted this approach slowed "the process a little bit because it would always be faster to just go in with prefab housing" built elsewhere. But helping local construction companies learn how to use local materials, including from the rubble, meant re-building damaged homes to a higher earthquake standard and "allowed us to work with and nurture a local construction industry," he said.""

Map of the World at Night and of the Korean Peninsula...Quite dramatic.

The World at Night. One of my favorite visuals of all time.  There are many things to observe on this map that says alot about geography, culture, economics, politics, etc in a country and region.  What do you see when you view the first map? The second map shows the Korean Peninsula in two different time periods, 1992 and 2008.  The South has changed considerably and in the North it is pretty much status quo---quite sad. (Source Aidwatchers)

Aidwatchers

Monday, January 24, 2011

The bright side to Imports---They help us Export! Huh? Answer within...

I was quite surprised by this graph. A little over half of the dollar value of  imports into the US are in the form of inputs---goods used as a component in a finished good (Industrial Supplies) or are used to make other goods (Capital Goods).  Ultimately both contribute to the manufacture of a finished product MADE IN THE USA, to be either sold domestically or exported.  I am just a high school econ teacher, but I think that means jobs for Americans. I pose the question: Why is our trade deficit such a problem? (HT: CafeHayek)

Carpe Diem


Why has the number of MD's produced by the nations medical schools been flat for 20 years?

Why has the number of Medical Doctors produced each year by the nations medical schools been relatively flat for 30(!) or so years?  This question is raised by Professor Mark Perry at Carpe Diem.
From USA TODAY: ""The marketplace doesn't determine how many doctors the nation has, as it does for engineers, pilots and other professions. The number of doctors is a political decision, heavily influenced by doctors themselves.  Congress controls the supply of physicians by how much federal funding it provides for medical residencies — the graduate training required of all doctors.
The United States stopped opening medical schools in the 1980s because of the predicted surplus of doctors. The Association of American Medical Colleges dropped this long-standing view in 2002 with the statement: "It now appears that those predictions may be in error." Last month, it recommended increasing the number of U.S. medical students by 15%. ""
He who controls the supply can dictate the price (Isn't this what the oil cartel OPEC does with oil prices?). What organization is a generous supporter of Federal elected officials and has one of the most powerful lobbying groups in the US?  The American Medical Association (AMA)...The Central Planners at the AMA who have input into the opening of new medical schools failed to predict the market need for Doctors...hmmm...I suppose only the AMA can perform surgery on an invisible hand and declare the patient healed.

The Chinese are invading the US...The weapon of choice is small appliances. Prepare your bunker (with small appliances from China of course)...

HT: Carpe Diem

Sunday, January 23, 2011

Ever wonder what the numbers on your Social Security Card mean? Here is an answer...


What do the numbers mean?
The numbers on your Social Security card actually mean something! SSNs are not assigned consecutively; the first was not the lowest number, and the most recent is not the highest. They are assigned regionally and in batches.

The nine-digit SSN, which has been issued in more than 400 million different sequences, is divided into three parts: area numbers, group numbers and serial numbers.

Area numbers - The first three numbers originally represented the state in which a person first applied for a Social Security card. Numbers started in the northeast and moved westward. This meant that people on the east coast had the lowest numbers and those on the west coast had the highest. Since 1972, the SSA has assigned numbers and issued cards based on the ZIP code in the mailing address provided on the original application form. Since the applicant's mailing address doesn't have to be the same as his residence, his area number doesn't necessarily represent the state in which he resides. For many of us who received our SSNs as infants, the area number indicates the state we were born in. You can find out which area numbers go with each state at SSA.gov: Social Security Number Allocations.

Group numbers - These two middle digits, which range from 01 through 99, are simply used to break all the SSNs with the same area number into smaller blocks, which makes administration easier. (The SSA says that, for administrative reasons, group numbers issued first consist of the odd numbers from 01 through 09, and then even numbers from 10 through 98, within each area number assigned to a state. After all the numbers in group 98 of a specific area have been issued, the even groups 02 through 08 are used, followed by odd groups 11 through 99.)

Serial numbers - Within each group designation, serial numbers -- the last four digits in an SSN -- run consecutively from 0001 through 9999.

Although SSNs are issued in some order, there is no simple way to tell a person's age based on his Social Security number.
View My Stats