Thursday, July 7, 2016

Gasoline prices and how they affect many markets. Nice practice!

Here is a terrific article from the WSJ (I think it is ungated) that illustrates a bunch of introductory microeconomic concepts within the Supply and Demand unit.

This paragraph speaks mostly to the Demand-side:
“Households had the potential to save $630 at the pump, of which they spent the majority58%. This spending provided more than a $200 boost to spending on non-gas goods and services, primarily restaurants and retailers. The lower gas prices also caused significant changes in household transportation choices, leading people to spend $150 more at gas stations and spend less on transit.”---WSJ Real Time Economics
Substitutes, Complements, movement along and a shifting of various Demand curve(s).

Happy graph drawing!

Monday, July 4, 2016

Theme Park Price Index and the Disney Effect.

I saw this line graph on my Twitter feed from the FRED data bank. It shows the change in the price index for "Amusement and Theme Parks" admission ticket prices.

They started at the beginning of 2006 with an index of 100.  As of May, 1 2016 the index was just a touch over 180.  This means that theme park ticket prices overall have increased by 80% in that time span.


My first thought when I saw this was what is the impact of Disney on the price of tickets.  I found this website which tracks their price changes.

I inserted RED bars (month and year on top) that show all of the Disney price increases (they had no price decreases) in this time period.

At the beginning of 2006 a single one day ticket to a Disney park was priced at $63.00 (see link above). Today a single day ("regular" price) is $110.00.  That is a 75% increase!

Remember, theme park (Six Flags et al) tickets increased by 80% overall.  Disney accounts for a disproportionate amount of that change.

If Disney admission tickets had just kept up with inflation during that time (using the CPI), ticket prices should only be $75.05, a 19.1% increase.

Seems clear that Disney is a "Price Maker" as opposed to a "Price Taker" and they are a "Price Leader" as well. However, the latter is harder to discern without doing the math.

When Disney raised prices did other theme parks follow suit at the same time?  If you look at the times in-between Disney price increases (gotta look really close) there seems to be a bump up in the line indicating a lag (sometimes short, sometimes longer) when other theme parks followed with price increases.

I did find it interesting that Disney elected to increase prices in the dead middle of the Great Recession (noted on graph in gray area).

Pricing power, indeed!

Friday, July 1, 2016

Brexit and exchange rates. A simple example.

Another short example of the effect "Brexit" has on trade in terms of the export and import of a finished goods from the UK .

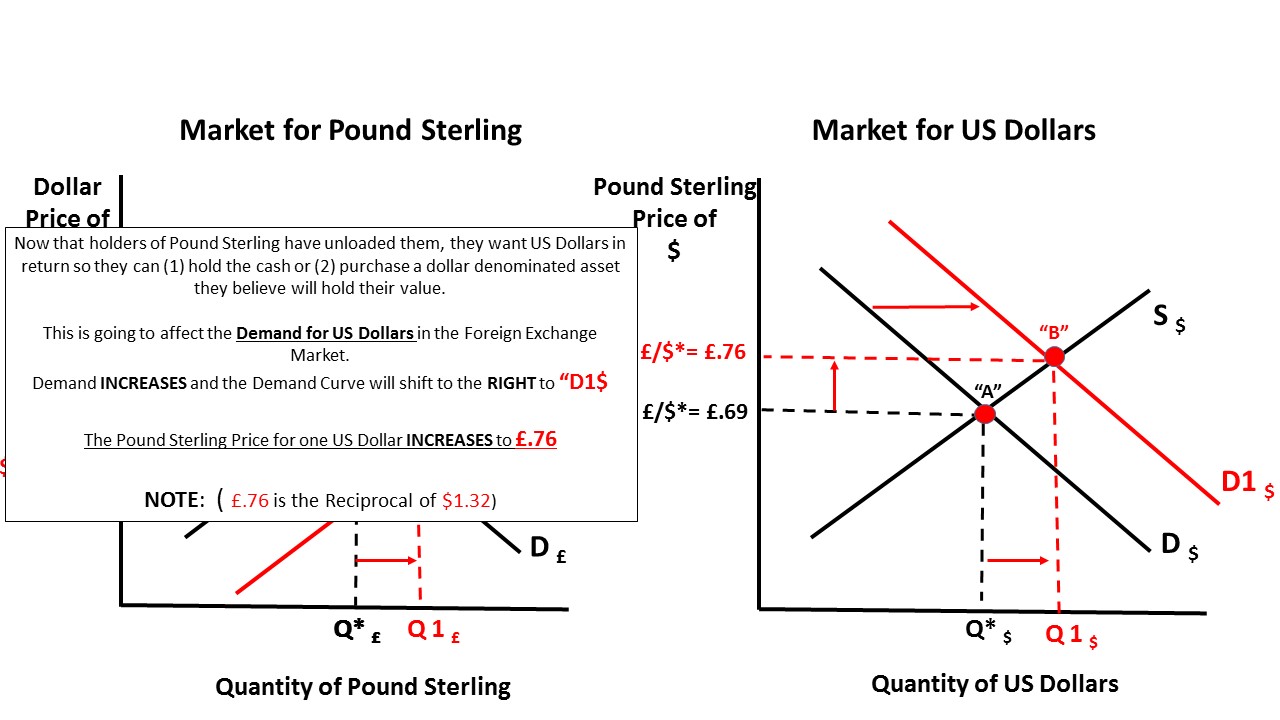
The British Pound Sterling just before Brexit was trading at $1.45 (approx)---To "buy" one Pound you had to "pay" $1.45US for it.

So, if you wanted to buy a good in the UK that was priced at 100 Pounds, you had to give up $145.00US dollars to purchase it.

Today post-Brexit the exchange rate is $1.33.  So to buy that same good for 100 Pounds, you would only have to give up $133.00.  Due to the change in the exchange rate, the UK is "on sale"---you save $12.00 or 8.3%.

Ceteris Paribus, this will serve to INCREASE imports to the US from the UK (vice versa, exports will INCREASE for the UK) for those holding US dollars---Law of Demand--as price goes down, quantity demanded increases.

So, how about in the other direction?  Before Brexit, for Brits to "buy" one US Dollar they had to "pay" .69 of Pound to purchase it (this is the reciprocal of the $1.45 from above).

If a Brit wanted to buy a good in the US that was priced at $100 Dollars, they would have to give up 69 Pounds to buy it.

Today, post-Brexit the exchange rate is .75 pounds (reciprocal of $1.33). To buy that $100 Dollar good now costs the Brit 75 Pounds.  Due to the exchange rate, the US is now more costly. Brits pay 6 Pounds or 8.7% more.

Ceteris Paribus, this will serve to DECREASE exports from the US (and DECREASE imports to the UK) for those holding Pound Sterling---Law of Demand---price increases, quantity demanded decreases.

Bottom line: British Jaguars are less expensive so the US may/will IMPORT more of them and the British may/will EXPORT more of them.  US Cadillacs are more expensive so the US may/will EXPORT less of them and the British may/will IMPORT fewer of them.

Trade as illustrated by changes in the exchange rate(s).  Hope this helps!

Tuesday, June 28, 2016

Brexit offers an opportunity for a short FOREX lesson.

The British Pound Sterling has taken a beating in the span of a few short days.  It went from about $1.46 (at times higher) to a low of $1.32.

Much of the commentary has been about holders of Pounds fleeing the currency and into a "safehaven". This means they are exchanging Pounds for other currencies in order to (1) hold cash in that currency or (2) purchasing a safe(r) asset with that currency (gold, bonds, etc).

The Foreign Exchange Market is a big part of the AP Macroeconomics curriculum.  It is one of the harder things to teach and I think one of the more difficult things for students to grasp.  After all, it is not something we routinely encounter in daily life BUT it does make its presence known in all facets of our economic lives.

Below I put together some slides illustrating a part of what happened with "BREXIT" in the UK and how students should understand the graphing elements as it pertains to an AP Macro class.

Hope it helps!!!


NOTE: The next slide has a typo.  Should be "RECIPROCALS".  Thanks.


When "structural unemployment" is actually a job creator---Bank teller edition.

One of the hardest things about teaching an introductory principles course like AP Economics is that, to a large degree, you have to teach many basic concepts in a fairly rigid manner.  I suppose it is a function of the AP test at the end of the year that always looms large over our heads.

The term "structural unemployment" has several meanings and definitions, but the AP curriculum/test is specific in what they are looking for---workers who lose their jobs due to advances or implementation in/of technology.  It has been, in some form, a question on the AP test for some time.

Example: The rise of ATM's reduces the need for bank tellers.  I use this example when trying to make the concept concrete to students.

I recently came across this blog entry (AEI) that to some extent "debunks" the nominal notion of structural changes due to technological advancement as a job killer:
"""...What happened? Well, the average bank branch in an urban area required about 21 tellers. That was cut because of the ATM machine to about 13 tellers. But that meant it was cheaper to operate a branch. Well, banks wanted, in part because of deregulation but just for deregulation but just for basic marketing reasons, to increase the number of branch offices. And when it became cheaper to do so, demand for branch offices increased. And as a result, demand for bank tellers increased...."""
So, yes, ATM's did reduce the need for tellers at ONE specific bank.

However, an unintended consequence is a decrease in the opportunity cost of opening additional branch banks that resulted in the need for MORE bank tellers overall.

The short blog entry at the link above is worth a read for a teacher and/or student. It adds nuance and complexity to a basic concept we teach/learn in a fairly inflexible way.

How depreciation of the Pound Sterling affects the Commoner.

Throughout the past year, the British Pound Sterling has been trading against the US dollar at roughly $1.46 (this is just an eyeball guess--I probably erred a bit on the low side, truth be told).

This means the holder of 1 Pound could exchange it and receive $1.46US.

Today (June 28, 2016) 1 Pound exchanges for $1.32.  Now 1 Pound "buys" $.14 (cents) LESS than it did a week ago.  The Pound Sterling has DEPRECIATED relative to the US Dollar.  It is worth less (not worthless!) than it was before the depreciation

How does can this affect a British citizen at home?

Assume a British importer imports $1,000 worth of Apples from the US.  Before the depreciation the importer had to give up 684.9 Pounds to order to buy the apples ($1,000 divided by the exchange rate for 1 Pound---$1.46US).

After the depreciation, the importer has to give up 757.6 Pounds in order to buy the apples ($1,000/ divided by the exchange rate for 1 Pound---$1.32US).

That is a difference of 72.7 Pounds or a 10.6% increase in the price the importer pays.  How do they make up for this?  Either they cut expenses elsewhere, take the loss in profits or increase the price of apples.

This is a quite unsettling sudden shock development for importers and/or domestic consumers of foreign goods and services.

However, it does not only affect importers of finished goods like apples that go directly to consumers for consumption.  The same analysis above applies to British businesses that purchase foreign INPUTS for the production of a domestic good and/or service.

If a British baker buys US apples to use in the production of apple pies, they face the same situation---an increase in the cost of production.  What to do--cut expenses, take the loss in profits or increase the price of apple pies?  Sound familiar?

Bottom line: Depreciation of a currency can (ceterus paribus) lead to broad increases in prices---Inflation.  There are LOTS of caveats with this so take it with a grain of salt.

Hopefully salt not purchased with a depreciating currency.

Sunday, June 26, 2016

What is the right Minimum Wage? In typical Economics fashion: "It depends"

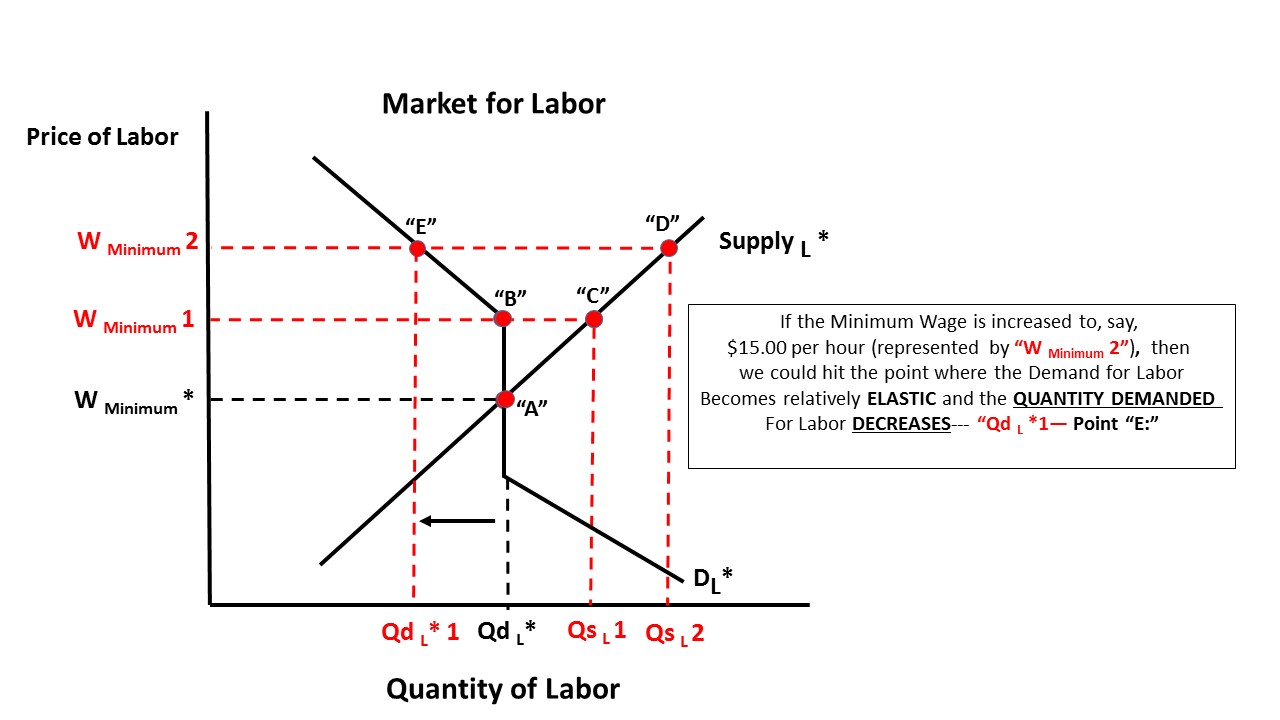
When I am asked whether or not we should have a higher minimum wage my answer is usually something like "a wage that helps all low/no skilled workers concerned and does not harm any current or future low/no skilled workers".  Admittedly not very helpful.

I put together some slides with explanations of how I try to objectively view the issue.  There maybe a sweet spot for the minimum wage.  Where that is, well, I fall back onto "it depends".  I think that is actually the best answer.

I hope this helps someone, teacher or student.  Feel free to comment.


Wednesday, June 22, 2016

Go ahead and take a "Big Gulp" before reading this...Soda/Soft Drink Taxes and Welfare Loss

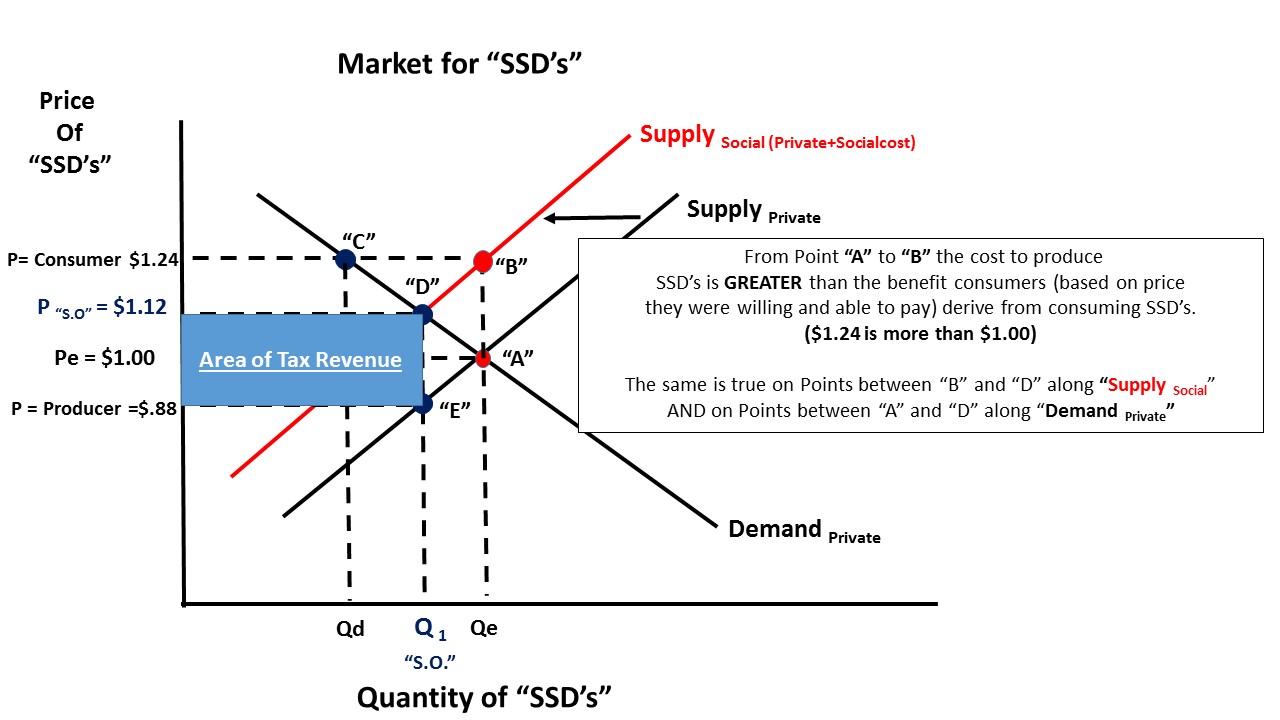
Recently the city of Philadelphia imposed a 1.5 cent per ounce tax on the sale of "Sugary Soft Drinks" or "SSD's" for short.

This means, for instance, a 16 ounce can/bottle of Coke will have an additional tax imposed totally $.24 (24 cents = 1.5 cents X 16oz).

The City believes this class of beverage causes health problems and costs that are not captured in the price of sugary soft drinks.

This is covered in AP Microeconomics in the unit on "Market Failure" where we learn how an external cost that is imposed on "third parties" specifically, or society in general, is not borne by the producer and/or consumer of the product.

Even though I might not consume soft drinks (or to the extent you do), I may have to pay for the health problems that stem from your consumption.

I put together a series of slides that explain with words and graphs how a government might address this issue through taxation to correct this "negative externality" and bring the market to a point where it produces SSD's at a more "socially optimal" price and quantity.

Hope it helps. Thanks.


Friday, June 10, 2016

Plastic Bag Tax in the UK. Correcting for a Market Failure.

An important unit in AP Microeconomics is the one on "Market Failure".

Specifically when there is the presence of a "Negative Externality"---a cost that occurs in the production and consumption of a good that is not included in the production and consumption of that good--but it imposes some harm on those not involved in the transaction.

Secondhand smoke from cigarettes is a good example.  When cigarettes are produced and consumed only the market price of the inputs are included in the price---not the costs that they might impose on the rest of us.

Plastic bags you see in grocery stores is another example. It is suggested that these bags impose significant damage to the environment in a number of ways.  And, heck, we get them "free" at the store.

This additional cost that is NOT borne by the producer or consumer of the good is called an "external cost".  How can we capture this external cost and compel it to be "internalized" by the parties who care the most---the producers and/or consumers?

From HERE:

"""Last year shoppers in the UK used an astonishing 8.4 billion plastic bags. Per person this means a plastic bag is used and disposed of every three days. 
Plastics have harmful effects and ecologists have singled out plastic bags as being particularly troublesome as they blow in the wind and can spread to remote environments. Governments are therefore trying to tackle plastic bag usage. 
In 2002 Ireland became the first country to introduce a plastic bag levy and UK countries have followed suit with Wales (October, 2011), Northern Ireland (April, 2013) and Scotland (October, 2014) implementing their own charges. Today a plastic bag levy for England has come into effect. 
The results of the plastic bag levies across UK countries, all starting from a similar point, are staggeringly successful. A 5p levy has seen plastic bag usage drop 78% in Wales and 80% in Northern Ireland while preliminary data from Scotland shows a remarkably similar 80% fall in use. The result also looks quite good, with marine litter surveys showing large declines in plastic bags."""
One way to internalize the cost is a tax by the government. This will raise the price of the good and if our Laws of Demand and Supply are correct (even half-way so) then we should see a reduction in production and consumption. At the minimum we compel the users of the good to bear the "true cost".

I put this to the test in a series of graphs and explanations. Look them over and I welcome any comments or constructive criticism.

Hope it helps. Thanks!


Saturday, June 4, 2016

Beer prices at Atlanta Falcons games are going down 37.5%. I predict problems will increase by more than that...

The professional football team Atlanta Falcons are opening a new stadium this year and have announced a drastic cut in the price of concessions people can buy.  Here is a link to the whole story.

The price of a beer will drop from $8.00 to $5.00.  In Microeconomics we know when there is a decrease in the price of a good/service the Quantity Demanded will increase (Law of Demand).

We move along the existing Demand Curve down and to the right (ceterus paribus).

Businesses care about profits. Profits come from Revenues.  A decrease in the price of beer from $8 to $5 is a minus 37.5%.

Now, business also care about elasticity of demand---the general slope of the Demand Curve.

In order for the vendor of beer at the stadium to get the SAME amount of revenue as before there must be, at a minimum, an increase of 37.5% in the quantity demanded for beer.

If it falls short of 37.5%, even though it increased, then Total Revenue will be less than before. Not a good strategy! This would suggest Demand is relatively INELASTIC.

If the quantity demanded is greater than 37.5% then Total Revenue will be greater than before. This would suggest Demand is relatively ELASTIC.  A win for the beer vendor!

Anyone see a problem? Does a 37.5% + increase in the flow of beer in a closed stadium pose some "external problems" that are not factored into the price?

On the benign side, more visits to the restroom equals higher sewage/water use.

On the more serious side, well, more drunks and all that entails at a sporting event.

I think alcohol prices should stay high.  Not for a personal preference, but for a better social outcome.

What do you think?


GDP and Water...

Found this on Twitter so it must be true...

If true, it is interesting that 50% (about $9 Trillion dollars) of GDP is produced in concentrated areas close to ports/water.  Historical patterns of trade are hard to break I guess could be an observation.

What do you see?


TSA-Pre Checks --- Quantity Demanded vs Change in Demand

Bloomberg has an article on TSA Pre-checks that provides another good example to illustrate a basic yet difficult to grasp Microeconomic concept: the difference between a change in Quantity Demanded when there is a change in price and a change in demand when something other than a change in price affects the market. Got that?
"""...The agency’s Pre-Check program is designed to fix that problem and move the lines—but only 2.77 million people have enrolled to date, far below projections. The TSA wants to have 25 million people signed up by 2019 for federal “trusted traveler” programs such as PreCheck, for domestic travel, and Global Entry, the program for international travelers run by the U.S. Customs and Border Protection.
"""...But according to the U.S. Travel Association, a lower fee and simpler application process would spur 7 million more people to enroll in the PreCheck program. In a statement Thursday, the group based its claim on a survey of 1,000 domestic travelers conducted March 7-10. Of the 1,000 people, 20.5 percent said they would likely enroll in PreCheck. Among the rest, half cited the $85 fee as the reason they would probably not enroll...."---(bold and underline are mine).
Let's take both of the claims made in the first sentence of this last paragraph, separately and then together, to see how this plays out on a market demand curve.


If you are reading this while standing in line to get through airport security, I hope it makes the wait more satisfying.  :)

Tuesday, May 3, 2016

Mexican Soda Tax and Change in Qd vs Change in Demand. FUN STUFF!

A couple of years ago, the Mexican government imposed a "soda tax" on soft drinks.  Lots of controversy at the time but the goal was (1) to address the issue of obesity and (2) raise some revenue to combat obesity.
WSJ: "...Sales of soda are climbing two years after Mexico imposed a roughly 10% tax on sugary drinks—a bright spot for an industry that has feared it could be cast as the next tobacco.
Mexico’s tax was an attempt to cap alarming obesity and diabetes rates in a country where per-capita soda consumption is the highest in the world. It came at a time when then Mayor Michael Bloomberg was trying to limit sales of the beverages in New York City, and more countries are weighing a similar tax. 
Purchases, however, are rising in Mexico after an initial drop, making the country a key-growth market again for soda giants Coca-Cola Co. and PepsiCo Inc. Underscoring the resiliency of sugary drinks, the tax of one peso per liter has raised more than $2 billion since January 2014, about a third more than the government expected...."
 The first sentence (actually first clause!) in that last paragraph caught my attention. I put it in bold.  It is a nice opportunity to analyze these few, yet impactful, words with a market Demand Curve.

This first graph shows a downward sloping Market Demand Curve of soda in Mexico BEFORE the imposition of the tax at some price "Pe" and some market quantity demanded "Qde" at Point "A". Easy enough:
When the tax is imposed the price is going to be something higher than "Pe".  

Key point:  The only thing that has happened in this market is the price of soda has increased due to the tax.  We will move ALONG the market demand curve UP and to the LEFT. 

We are now at "Pe +Tax" and a lesser quantity demanded at "Qd1" at Point "B" 

Price goes up, Quantity Demanded goes down. Sound familiar?---Law of Demand!


But our key phrase from the article says that the quantity of soda consumed is now increasing after the initial decrease.  So what happened?
"...Anti-soda groups aren’t ready to declare the tax a failure and say sales got a boost from unusually warm weather..."--WSJ
So, something OTHER THAN THE PRICE of soda affected the Demand for Soda. 

Now, at Pe+Tax the Quantity Demanded is GREATER than it was before ("Qd1").  For simplicity I use the new quantity demanded back at "Qde"---we move from Point "B" to Point "C". 

Key Point:  As shown below, the market demand curve shifts to the RIGHT indicating an increase in Demand for Soda in Mexico, relative to the prior condition.


This article contains  MANY basic Microeconomic concepts but I really liked it because it nicely, if implicitly, illustrated the difference between a "Change in Quantity Demanded" and a "Change in Demand".

This is no small thing when trying to understand Microeconomics.

I hope it helps someone.


View My Stats