Showing posts with label Trade. Show all posts

Wednesday, January 3, 2018

Another reminder of the importance of the supply chain for a good.

Here is a graphic from a French publication that nicely illustrates the importance of the regional and global supply chain for inputs that go into making an output, in this case the Honda Civic assembled in the UK/EU region.

These supply chains are very tight and help contribute to efficiencies that keep prices low(er).

It is also a nice lesson in Comparative Advantage.


Source HERE

Wednesday, December 20, 2017

Do we buy stuff from Countries OR do we buy stuff from people? Here is a different look at US trade numbers.

Trade numbers are published on a national level---comparing country to country. No problem with that, but here is another way to frame the numbers.

We trade with the actual, real live citizens of the respective country. They buy our stuff and we buy theirs.

So, how do the national trade numbers look when we quantify them on a per person basis?

Below is a graphic I created to show the US trade balance with the Top 10 (plus the EU Area) trade partners as a balance nationally (yellow) and on a per person (capita) basis.

I took the value of US exports to the respective country and divided it by the population of that country. This gives the dollar value of US goods on per person basis the person bought. I then took the value of imports from a country and divided it by the US population. This gives the dollar value of the foreign goods US citizens bought. The difference between the two numbers gives a per person SURPLUS of DEFICIT in trade between the countries.


Notice nationally the US has trade DEFICITS with all trading partners, except the UK.  But if we look at it on a per person basis, we have trade deficits with only 3 countries (the EU as a whole, China, and India).

In other words, for the most part, in trade the US citizens buy less from foreigners than they buy from us---we run person to person trade SURPLUSES.  Only with the relatively poor countries of China and India do we buy more from them then they buy from us.

Tuesday, August 15, 2017

Wording for Correct answers for Foreign Exchange Market (FOREX) on the AP Macroeconomics FRQ's

On the AP Macroeconomics exam you can be 99% certain you will be asked Foreign Exchange Market question(s) on the FRQ section of the test.

Precise and to the point answers are required.  They are looking for the proper linkages from the various cause and effect scenarios you are presented with.

Below I wrote out what would be the "best way" to respond to these questions.  You may be asked to identify and explain ALL the effects under each bullet point or maybe just one (for example, only what happens to Exports given an event---all the rest is implied and you have to understand it in order to get to what happens to Exports).

My advice is to memorize these until they "click".  Again, they contain ALL the key words/phrases that past FRQ rubics have required students explicitly mention.

NOTES:  BE CAREFUL with #3 through #6.  They seem very counter-intuitive what happens to the value of the dollar given the scenario.  These can easily trip you up.


1. “If the interest rate in the U.S. INCREASES relative to the Rest of the World (ROW), U.S. financial assets become more desirable.  The demand for the dollars INCREASES and APPRECIATES the value of the dollar internationally. “
Effect on Exports: When the dollar APPRECIATES in value, U.S. goods and services become relatively MORE expensive and Exports will DECREASE.
Effect of Imports: When the dollar APPRECIATES in value, Foreign goods and services become relatively LESS expensive and Imports will INCREASE.
Effect on Net Exports (N(x): If Exports Decrease and Imports Increase, then net exports will DECREASE.

2.If the interest rate in the U.S. DECREASES relative to the Rest of the World (ROW), U.S. financial assets become less desirable.  The supply of the dollars INCREASES and DEPRECIATES the value of the dollar internationally. “
Effect on Exports: When the dollar DEPRECIATES in value, U.S. goods and services become relatively LESS expensive and Exports will INCREASE.
Effect of Imports: When the dollar DEPRECIATES in value, Foreign goods and services become relatively MORE expensive and Imports will DECREASE.
Effect on Net Exports (N(x): If Exports Increase and Imports Decrease, then net exports will INCREASE.

3. If price levels in U.S. are LOWER relative to Rest of the World (ROW) then U.S. goods and services become MORE desirable. The demand for the dollars INCREASES and APPRECIATES the value of the dollar internationally. “
Effect on Exports: When the dollar APPRECIATES in value, U.S. goods and services become relatively MORE expensive and Exports will DECREASE.
Effect of Imports: When the dollar APPRECIATES in value, Foreign goods and services become relatively LESS expensive and Imports will INCREASE.
Effect on Net Exports (N(x): If Exports Decrease and Imports Increase, then net exports will DECREASE.

4. If price levels in U.S. are HIGHER relative to Rest of the World (ROW) then Foreign goods and services become MORE desirable. The supply of dollars INCREASES and DEPRECIATES the value of the dollar internationally.
Effect on Exports: When the dollar DEPRECIATES in value, U.S. goods and services become relatively LESS expensive and Exports will INCREASE.
Effect of Imports: When the dollar DEPRECIATES in value, Foreign goods and services become relatively MORE expensive and Imports will DECREASE.
Effect on Net Exports (N(x): If Exports Increase and Imports Decrease, then net exports will INCREASE.

5. If GDP INCREASES in the U.S. relative to the Rest of the World, then Americans will want to buy not only MORE domestic goods/services, but MORE foreign goods/services also. The supply of dollars INCREASES and DEPRECIATES the value of the dollar internationally.
Effect on Exports: When the dollar DEPRECIATES in value, U.S. goods and services become relatively  LESS expensive and Exports will INCREASE.
Effect of Imports: When the dollar DEPRECIATES in value, Foreign goods and services become relatively MORE expensive and Imports will DECREASE.
Effect on Net Exports (N(x): If Exports Increase and Imports Decrease, then net exports will INCREASE.

6. If GDP DECREASES in the US relative to the Rest of the World. then Americans will not only buy FEWER domestic goods/services, but FEWER Foreign goods/services also.  The supply of dollars DECREASES and APPRECIATES the value of the dollar internationally.
Effect on Exports: When the dollar APPRECIATES in value, U.S. goods and services become relatively MORE expensive and Exports will DECREASE.
Effect of Imports: When the dollar APPRECIATES in value, Foreign goods and services become relatively LESS expensive and Imports will INCREASE.
Effect on Net Exports (N(x): If Exports Decrease and Imports Increase, then net exports will DECREASE.

Monday, August 14, 2017

Absolute and Comparative Advantage for Dummies...like me.

Here is my very detailed look at how to calculate Absolute and Comparative Advantage for AP Economics.  Overkill? Maybe, but it is a step by step look at how to do it that I think would be helpful to teachers and students alike.  Kinda wish I had the "Trade for Dummies" breakdown when I was first learning it.

Hope it helps someone have a breakthrough.


Wednesday, November 23, 2016

Wall Board (Sheet Rock) Tariffs Levied by Canada.

I am kinda bored on Thanksgiving Eve.  Read this article on tariffs Canada is going to levy on Wall Board (Sheet Rock) that is used to finish out walls in houses and other structures. Gotta have it if you want to build a house!

Canada accused US producers of Wall Board of "dumping" the product in Western Canada a prices "below cost".  The suggestion is that US producers are trying to out price Canadian producers and put them out of business.

"""A new trade dispute has broken out between Canada and the U.S. that threatens to raise prices in Canada’s already overheated housing markets. 
The Canada Border Services Agency imposed a provisional tariff as high as 277 per cent on U.S. drywall imports in September after ruling that manufacturers were dumping the product, or selling it below the price in their home market, undercutting local suppliers. 
The tariff has raised the price of drywall, or gypsum board as it’s also called, by as much as 30 per cent and is causing “chaos” and delays as contractors scramble for alternative sources. 
Some builders say the tariff could add as much as $13,000 to the cost of a new home, which would amount to a $2.6-billion increase to the roughly 200,000 homes built in Canada each year.""" (from Globe and Mail)
Here are some graphs I made to go along with the article.  Tariffs are a tested concept on the AP Microeconomics test so hopefully this will be helpful to someone.


Friday, November 18, 2016

Nice excerpt from the WSJ that illustrates Comparative Advantage.

The following is from a WSJ article on the automaker Ford's decision to produce a model in the US versus perhaps moving production to Mexico.  The article is about the politics of the situation, but the following excerpt caught my eye
"...Like many of its rivals, Ford is increasing production of more profitable trucks and sport-utility vehicles in the U.S. while investing to boost output in Mexico for lower-margin small cars...." (WSJ)
Without mentioning it by name, this nicely sums up the microeconomic concept of "Comparative Advantage" all students learn at the beginning of a semester of basic economics.

Ford can use its factories to produce either small lower profit margin cars or they can use them to produce larger higher profit trucks and SUV's.  They could conceivably do both but, assuming limited resources, the factories (and the workers) produce higher value with the larger vehicles.  

The Opportunity Cost of producing trucks and SUV's  (large profit margin) is what they give up in small car production (small profit margin).

The Opportunity Cost of producing small cars (small profit margin) is what they give up in trucks and SUV's (large profit margin).

Which is a more economically efficient allocation of a nation's scarce resources?

Monday, September 5, 2016

Determining Comparative Advantage the "Easy Way'.

One of the hardest concepts for students (and teachers!) in the beginning of an economics course is Comparative Advantage. Specifically, determining the Opportunity Costs and then figuring out which country has the Comparative Advantage in the production of a good.

I think the confusion lies in the requirement that we look at the Opportunity Costs of producing one good in terms of the other, i.e. "the Opportunity Cost of producing 1 bushel of Corn is .5 bushels of Wheat".

I believe I have a "fail-proof" method that shows students who are having a hard time with the concept how to get the right answer EVERY TIME.

The slides below represent the second step in the process of determining Comparative Advantage.  If you are not sure how these were established go HERE for that explanation.
I will do a follow-up to this presentation, using this example, to show how acceptable "Terms of Trade" are determined in order for trade to be advantageous to both parties.


Friday, September 2, 2016

Comparative Advantage using "OOO"---Output Other Over". A concise explanation...

I put together the following slides to give you a step by step understanding of how this concept works. It can be confusing, as you have already found out.  "IOU"---Input Other Under" is in the works and I will post that as well.


Comparative Advantage using "OOO"---Output Other Over". A concise explanation...

I put together the following slides to give you a step by step understanding of how this concept works. It can be confusing, as you have already found out.  "IOU"---Input Other Under" is in the works and I will post that as well.


Monday, September 15, 2014

Literally and figuratively the butter spread is getting wider. See how that affects trade flows.

The price of butter has surged in recent days as well as recent months. Here is a graph I created showing the price of butter in the US and in world markets.  The prices are per pound based on a  metric ton (2204.62 lbs) so this is the price at production for wholesale sale, NOT RETAIL (the price you see at the store).

The world prices since 2/19/2013 are in RED and the US price is in BLUE.

Notice, of the most part, world prices are consisently above the US price but a crossover occurs between March 19th and April 19 of 2014.  Then there is a significant diverence where the US price quickly outpaces the world price.

As of today (9/15/2015) the US price is at $3.00 lbs and the world price is about $1.25 (Source) so on the graph the RED world price line end point is the same but the US red line extends up to the $3.00 mark.  The spread is even wider than what appears on the graph!

Source: Haywardeconblog. Using historical data from HERE and HERE
This gives me an opportunity to do a lesson on international trade to show what happens in markets when the world price of a good is differnt from the domestic price and how trade flows might be affected.


Thursday, February 20, 2014

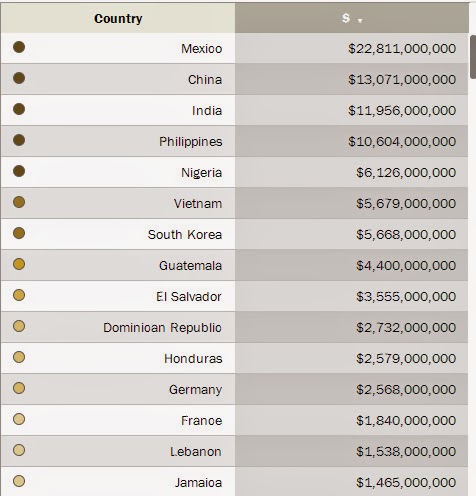
How much did foreign citizens working in the US earn and send home in 2013? And where is home? See the BIG numbers here...

When we study Balance of Payments (see here for latest report) as a part of the International Trade unit, one topic that is always of interest to students is "Unilateral Transfer Payment (net)".  A sub-topic of that is "Remittances".

Remittances are US dollars that foreign nationals earn in the US and send back to their home country. On net the US sends out more dollars than are returned to the US by US citizens living abroad and sending payments home.

Pew Research (a bonanza for blog fodder lately!) has a nice interactive map and data on remittances.

Here are Top 30 destinations for US dollars being "exported" abroad:


Here is a 2010 list of the Top 25 recipients of US Foreign Aid (tax dollars).  I highlighted the countries that appear on the remittance list above too.  In several cases, the residents of these countries are in the working in the US and sending home MORE US dollars than we send them in foreign aid.

Source: HERE

View My Stats