Showing posts with label Supply and Demand. Show all posts

Wednesday, August 9, 2017

Negative Externality: Meat industry blamed for largest-ever 'dead zone' in Gulf of Mexico

suggests that the market quantity for meat products is greater than it should be.  The chemical run-off of fertilizers and other agricultural inputs that go into the production of meat products flow into waterways.  Its negative affects go much further than the borders of the farms and ranches. Some excerpts:
"Toxins from manure and fertiliser pouring into waterways are exacerbating huge, harmful algal blooms that create oxygen-deprived stretches of the gulf, the Great Lakes and Chesapeake Bay, according to a new report by Mighty, an environmental group chaired by former congressman Henry Waxman... 
...Nutrients flowing into streams, rivers and the ocean from agriculture and wastewater stimulate an overgrowth of algae, which then decomposes. This results in hypoxia, or lack of oxygen, in the water, causing marine life either to flee or to die... 
...America’s vast appetite for meat is driving much of this harmful pollution, according to Mighty, which blamed a small number of businesses for practices that are “contaminating our water and destroying our landscape” in the heart of the country..."
If the problem IS production over a more "socially optimal" level of production, how do we attain that optimal level?

The essential problem is that the cost of the externality is not being borne by the consumer or producer of the product.  Consumers are paying and producers are receiving only the money cost to make the product available. They are not paying for the residual costs of environmental degradation that affect others near and far (out into the Gulf of Mexico!).

Our task here is to use the basics of Supply and Demand to illustrate how markets respond to government intervention in order to require Producers and/or Consumers to "internalize" that "external" cost that has been imposed on the rest of society.

Internalizing that cost can take the form of an explicit tax on the good or some other "non-monetary" rule or regulation that de facto internalizes the cost of producing the good.

I put together a short-ish presentation to show you how this is modeled for AP Microeconomics. The key here is to correctly identify the "area of Dead Weight Loss" in the presence of a Negative Externality.


Tuesday, August 1, 2017

The most prominent determinant for a "change in supply" is a change in the cost of an input that goes into the production of an output (final good).

This article uses the example of the input cream that is used in the production of the output butter in the UK.

Rising price of cream squeezes Dairy Crest's margins

“Cream prices, which determine input costs for the butter business, have increased substantially during the first quarter,” the company said.
“This will put pressure on margins in our butter business. We have reduced our promotional activity on Country Life, which is adversely impacting volumes but mitigating some of the margin pressure.” (underlining mine)
Here are some slides to walk you through a basic demand and supply model to illustrated how this impacts the market for butter as described in the article.

Tuesday, July 25, 2017

How to answer basic Demand and Supply Problems in 3 easy steps.

Determining which curve to shift in the simple Demand and Supply model can be a challenge for students.

Students tend to rush and "over-think" the problem and/or they want to jump ahead a step or two and look at the subsequent effect a particular scenario has on a market.

My advice is "KISS!" (Keep It Simple Students!).

Here is my recommendation as to how to logically think about a given scenario and to get the curve shift right every time.  All in 3 easy steps.

First, you need to be familiar with the Determinants of Demand or Supply:

Factors that affect DEMAND (cause the Demand Curve to SHIFT):
  • change in consumer tastes
  • change in the number of buyers
  • change in consumer incomes
  • change in the prices of complementary and substitute goods
  • change in consumer expectations
Factors the affect SUPPLY*** (cause the Supply Curve to SHIFT):
  • change in input prices
  • change in technology
  • change in taxes and subsidies
  • change in the prices of other goods
  • change in producer expectations
  • change in the number of suppliers
***With SUPPLY, the primary reason you will encounter for Supply Curve shifts is a change in the COST OF PRODUCTION.  When the Costs of Production increases, Supply decreases (curve shifts LEFT). When Costs of Production decrease, Supply Increases (curve shifts RIGHT).

With these determinants in mind, here are the next questions you will want to ask yourself when confronted with a scenario that will shift either the Demand or Supply Curve.
1. Ceterus Paribus (holding all other variables constant--except the one we are addressing) ask yourself  "Is this scenario a function of Demand or Supply?"  Look at your Determinants listed above---make sure you confine yourself to these determinants and do not read more into it! 
2.  After determining which curve to shift ask yourself: ""Will this scenario have a POSITIVE ("good") or NEGATIVE ("bad") impact on Demand or Supply (whichever you decided in question #1)
3.  (a)  If it has a positive impact the curve will shift RIGHT.  This is true whether you    are shifting the Demand OR Supply Curve.
     (b) If it has a negative impact the curve will shift LEFT.  This is true whether you are          shifting the Demand OR Supply Curve.
After you shift the appropriate curve, simply locate the new equilibrium point where Demand and Supply intersect showing a new Price and Market Quantity.

Here is a link to a Google Doc that has some examples for you to work on. Once you establish a rhythm, these get very easy to do.

BIG CAVEAT:  This works well with basic introductory problems in Supply and Demand analysis. HOWEVER, when we go a bit deeper you will encounter at least one situation where the answers are counter-intuitive to the above explanation, especially on the Demand-side.  That is when the scenario suggests that the good is a "Normal Good" or an "Inferior Good" as it relates to a CHANGE IN INCOME (a function of Demand).  For instance, if the good is "Inferior" and incomes INCREASE, then the demand for that Inferior good will DECREASE (shift LEFT). If income Decreases, Demand for the Inferior good INCREASES.  Be careful with this one!

Tuesday, July 18, 2017

Bacon and Supply/Demand Graphs. What a great breakfast combination.

A nice article to practice graphing Supply and Demand.  

America’s Lust for Bacon Is Pushing Pork Belly Prices to Records


Once considered an unhealthy byproduct, bacon has become a guilty pleasure—with prices to match.

Excerpt for graphing:
""Some analysts say bacon, meanwhile, is becoming a yearlong staple that consumers are eager to procure. That voracious demand has left wholesalers in a squeeze. Retailers “have turned hand-to-mouth, buying only what they need, waiting for production to increase and prices to decline,” said Dennis Smith, a commodities broker at Archer Financial Services in Chicago. 
Pig farmers are struggling to keep up with demand. The national hog herd rose to a seasonal record of 71.7 million head in early June, according to the U.S. Department of Agriculture, up 3% from a year earlier. 
But it hasn’t been enough to satiate bacon demand. Stocks of pork bellies in commercial freezers fell to 31.6 million pounds in May, down 59% from a year earlier and the lowest figure for the month since the USDA began keeping track in the 1950s.""

Wednesday, December 14, 2016

Supply and Demand for Rubber, Tires and Cars. Graphs to Illustrate.


From: Financial Times:

China’s buoyant car sales boost rubber price

Expectations of robust demand from China boosted rubber to a three-year high after buoyant car sales data for November lifted expectations of higher tyre demand.
The China Association of Automobile Manufacturers reported vehicle sales of 2.9m in November, up 16.6 per cent year on year. Tax breaks introduced this year on small passenger cars have spurred demand and while the November figure was down from a September peak of 26.1 per cent, it marked the sixth straight double-digit rise in growth.


There are three different things going on here that we can graph. One affects the Market for Rubber, one the Market for Tires (or the British spelling "tyres") and the Market for Cars in China (and elsewhere, truth be told).

Here are a series of graphs that illustrate how each market could be affected by the change in market conditions.


Saturday, October 8, 2016

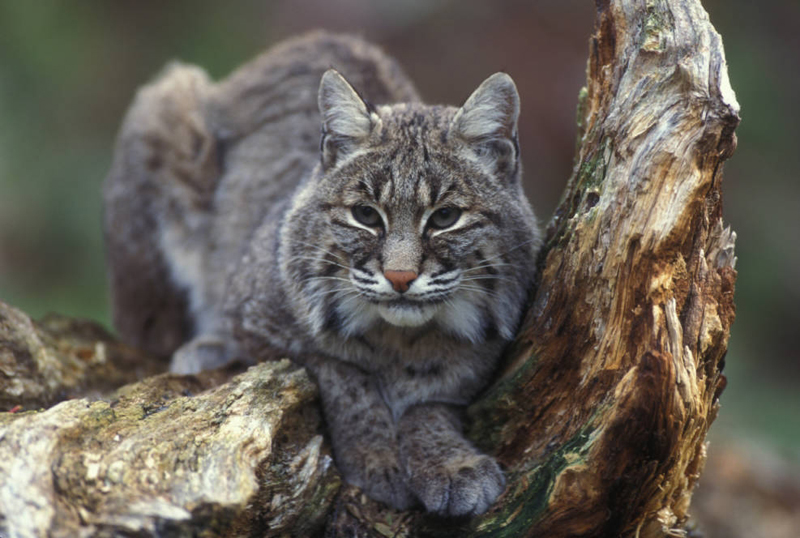
Bobcat hunting permits and Basic Economics. Not sure which gets killed more cruelly.


Here is an interesting article that shows conflict between basic economic principles and a social policy that makes for a terrific lesson.  The following is an excerpt from a media source in the State of Illinois (any highlights are mine):
6,000-plus apply for 500 bobcat permits; some aren’t hunters
"""More than 6,000 people applied for the 500 permits available to hunt for bobcats this fall in Illinois, which is having its first legal bobcat hunting season in more than 40 years. 
The Illinois Department of Natural Resources received 6,416 applications, which it accepted throughout the month of September, for 500 available permits, according to the Carbondale Southern Illinoisan. 
A lottery will be held to determine who gets the 500 available permits. 
Some of the applicants apparently are opposed to bobcat hunting, and would not be using any permits they receive. Rockford resident Jennifer Kuroda started a Facebook group called Illinois Bobcat Conservation, on which she encouraged opponents of bobcat hunting to apply for permits, according to Chicago radio station WBEZ. 
“I don’t feel that badly about doing it because I feel strongly that these animals need to be conserved at some level,” Kuroda told the radio station. 
Kuroda said 11 of her friends have applied for permits. 
The fee to apply for a bobcat permit is $5. Hunters who harvest one are required to purchase a possession permit for another $5. 
The bobcat was once listed as a threatened species in Illinois, but the designation was removed in 1999.""""
Read more here: http://www.bnd.com/news/local/article105844877.html#storylink=cpy

The number of permits issued is fixed at 500. No more will be issued. We can assume the Supply of Permits is Perfectly INELASTIC---regardless of the price, only 500 will be available.

The State has set a price of $5.00 for each permit. We can assume there will be a demand for these permits at that price. This is how the "equilibrium" sets up---but not for long:


We know from the response there are at least 6,000 people who would like a permit at $5.00. Quantity Demanded is greater than Quantity Supplied.

There is a shortage in this market of 5,500 permits at $5.00.

 Ceteris Paribus, what is true at $5.00 and Point "B" is going to be true at every other point on along "D*"---at some price the Quantity Demanded is going to be greater than it was before. The market Demand Curve shifts to the RIGHT.
In this case the "true" market price would rise to some price higher than "Pe = $5.00"  to "P 1= ???" at Point "C".

However, Illinois does not seem predisposed to do this. They also do not allow the permit to be transferred from one person to another.

This, in effect, puts a "Price Ceiling" on the permits---the price is not allowed to rise above $5.00.

What are the costs of this policy?
 1. Lot's of people can't get a permit. Consumer Surplus is diminished.
 2. Right now the State gets a total of $2,500 for issuing the permits ($5 each X 500).  That CAN'T possibly cover the costs of permit issuing and enforcement, can it?
 3.  LOTS of foregone fee  revenue! Would 500 of that vast surplus of consumers/hunters be willing and able to pay $1,000 for a permit? $2,000? More?

Why only $5.00?  The only reason I can think of is the issue of "equity"---a low permit price allows low income people the opportunity to participate in the hunt.  That seems like a weak argument to me given what is at stake.

What are the benefits of this policy?

Any ideas?

POSTSCRIPT: I did not include in the calculation (but should have) in the total revenue the fact that anyone just APPLYING had to pay $5.00.  So the actual total revenue generated is greater than I posited.  However, my question still stands---why is the permit so cheap?

Wednesday, August 24, 2016

Surplus Cheese and US Agricultural policy. Let's go to the graphs.

I don't see this surplus as a problem but an opportunity for more Queso dip!

The US government is buying 11 million pounds of cheese because no one else will
""There is way too much cheese in America, so the US Department of Agriculture is buying a massive amount of it. 
According to a release from the USDA, it will buy 11 million pounds — worth roughly $20 million by its estimate — and distribute it to food banks around the country."""
The US cheese market has had a significant oversupply problem for most of the year because foreign buyers have looked elsewhere for their dairy products as a result of the strong dollar. Before this slowdown in exports, many farmers had ramped up their production because of record-high prices."""
This situation presents another opportunity to "go to the graphs" to explain what is going on in the Market for Cheese.


Wednesday, August 17, 2016

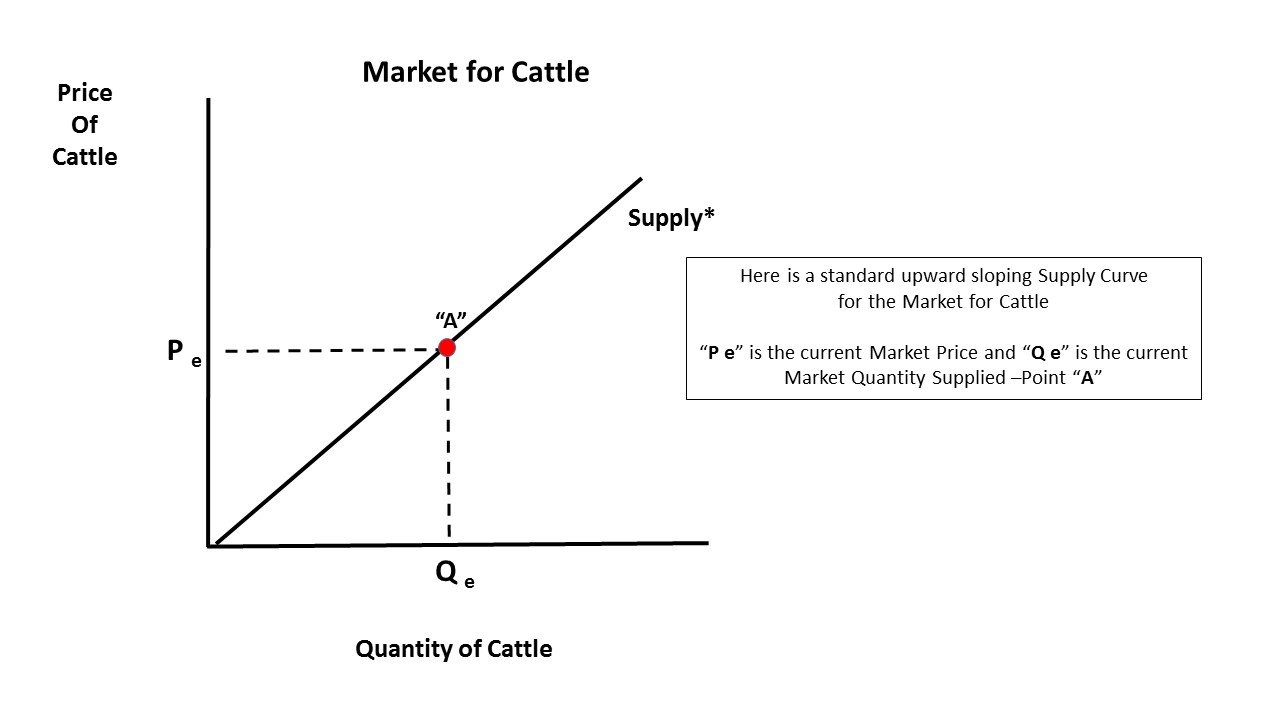
Market for Irish Cattle---Change in Quantity Supplied vs Change in Supply

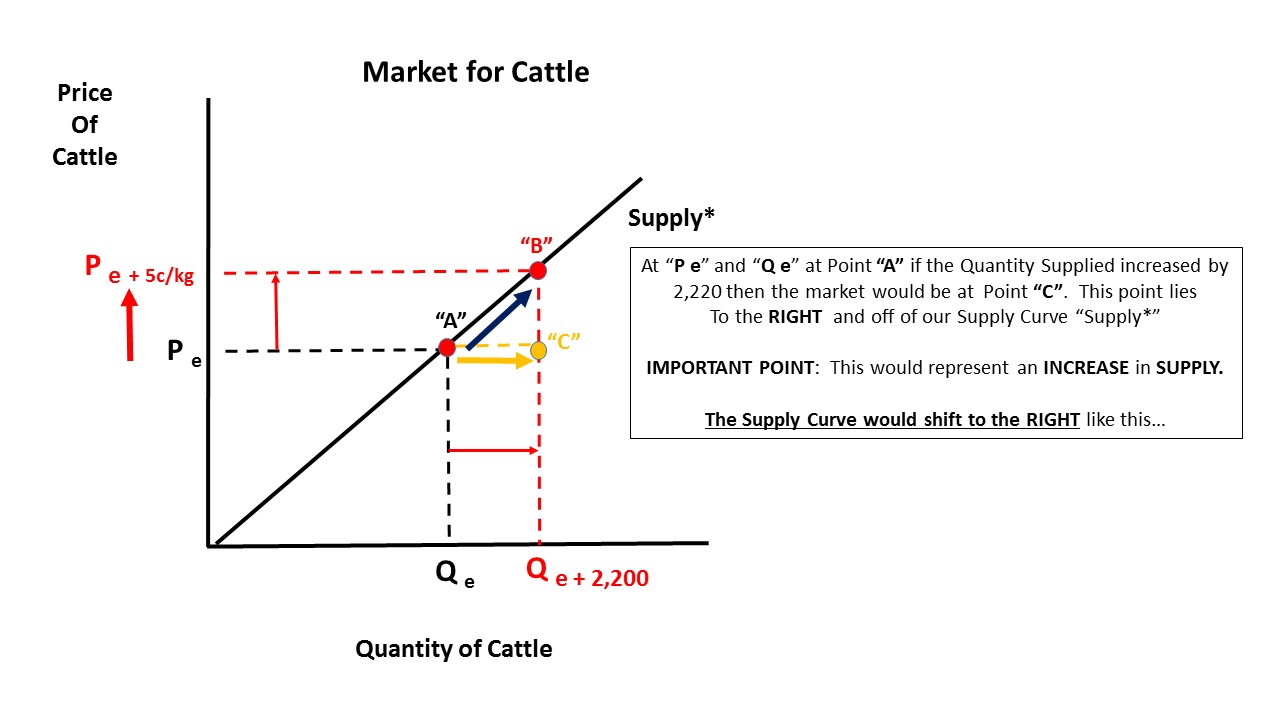
One of the most frustrating things to teach AND learn in a basic microeconomics class is the difference between a change in Quantity Demanded and/or Supply and a change in Demand and/or Supply---whether we move along the respectived curve or the curve shifts entirely in one direction or the other.

This very short article from a website that reports on agricultural issues in Ireland provides a nice example on the supply side to illustrate the difference:
The number of prime cattle slaughtered at Department of Agriculture approved beef export plants has jumped 10% in the space of a week. 
Figures from the Department show that the throughput of young bulls, steers and heifers increased by just over 2,200 head last week compared to the week before. 
Towards the end of last week and into this week, factory buyers were willing to pay an extra 5c/kg on top of the base price in order to secure stock.And this move appears to have worked, as an additional 2,285 cattle were presented for slaughter during the week ending August 14.
Here are some slides that will help explain the difference. Hope it helps!


Monday, August 15, 2016

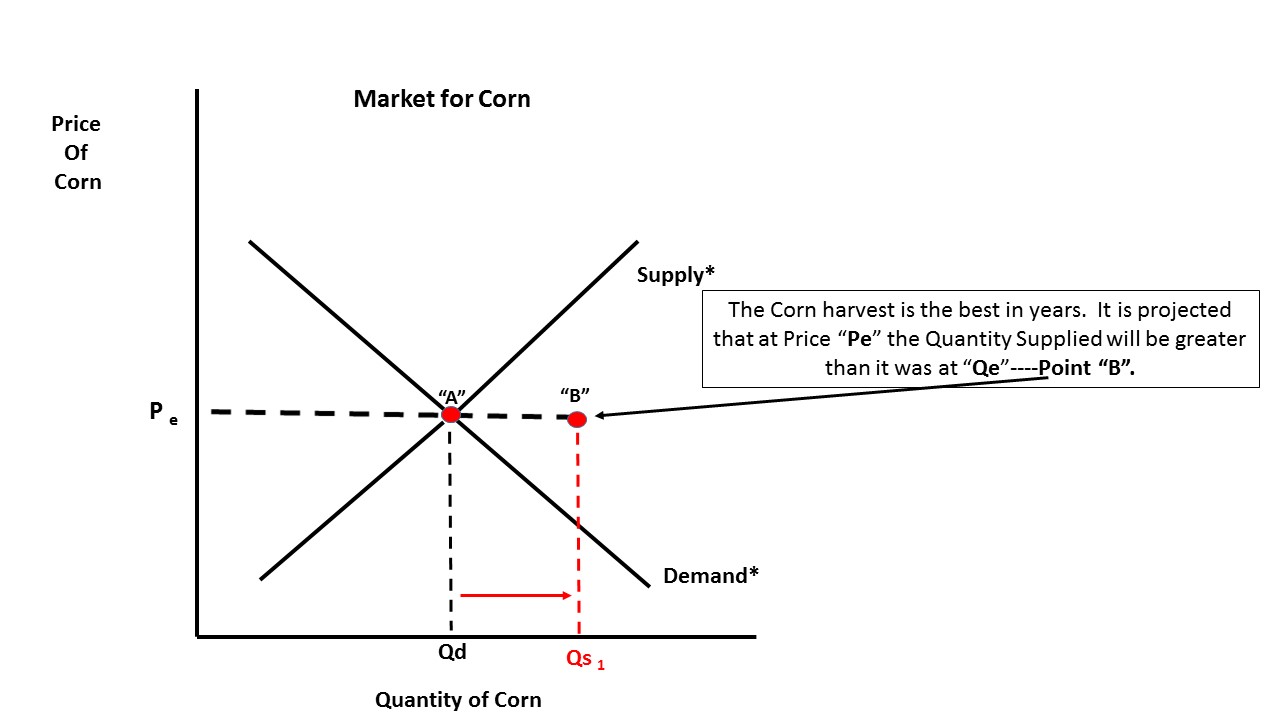
A supply and demand lesson with agriculture in one snapshot of a webpage...Oh, and I made some graphs too!

A supply and demand lesson with agriculture in one snapshot of a webpage (Morning Ag Clips)


Lower prices are NOT what farmers want to hear!

While not an exhaustive list, there are basically 3 things that can happen with Agricultural policy in the US that can affect the market for corn assuming the condition presented above---(1) buy up the surplus or (2) use subsidies or (3) do nothing.

I put together some slides to illustrate how each policy may affect the market.


View My Stats