This is an important part in the Unit on Fiscal Policy. The math, while simple, seems to be a stumbling block for many students. Hopefully this eases that tension!
Showing posts with label Keynesian POV. Show all posts
Showing posts with label Keynesian POV. Show all posts
Tuesday, August 15, 2017
Keynesian Multiplier Effect Illustrated
Here is a presentation I created that explains the Keynesian Multiplier Effect in as simple terms as I can make it. I bit long in number of slides for that reason.
This is an important part in the Unit on Fiscal Policy. The math, while simple, seems to be a stumbling block for many students. Hopefully this eases that tension!
This is an important part in the Unit on Fiscal Policy. The math, while simple, seems to be a stumbling block for many students. Hopefully this eases that tension!
Friday, November 25, 2016
Keynes vs Classical Model to reach Full Employment in a Recession.
This AP Macroeconomic test topic is always a bit confusing for students AND teachers alike. I struggled with it for a long time.
Here are some slides and in-between them some explanation. Hope it helps someone out there.
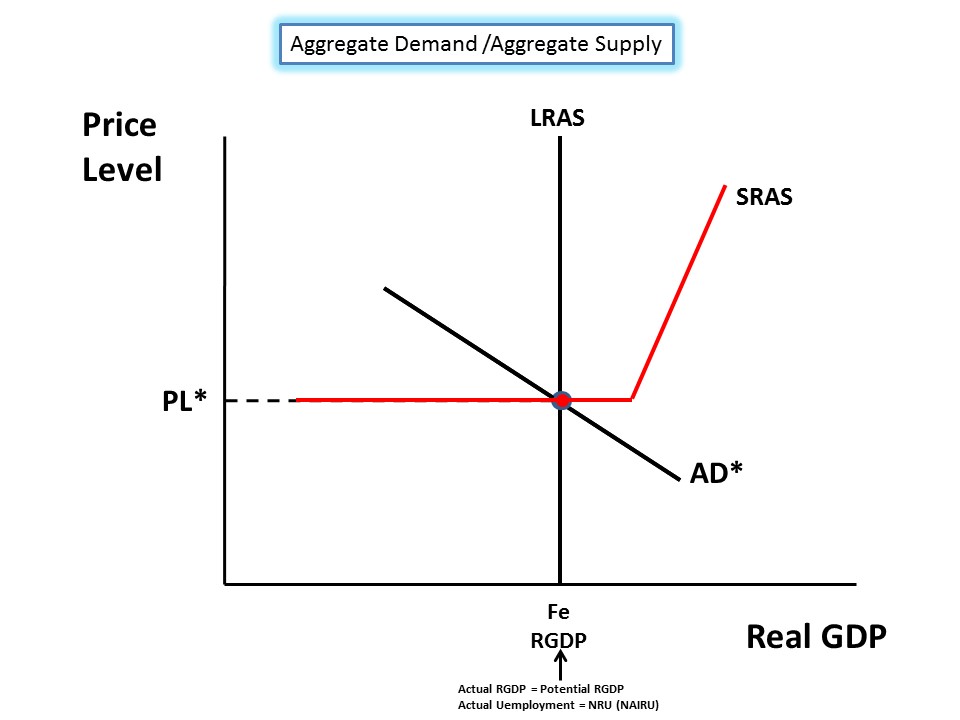
Here is the basic AD/SRAS/LRAS showing the economy at Full-Employment. All the curves intersect at the same sweet spot. This is what you draw if asked on the AP FRQ portion of the test. However....

If you are asked about the "Keynesian Range" of the SRAS curve then you have to look at it like the graph below. The Keynesian Model assumes "Sticky Prices and Wages" (this is usually a key phrase used on the test to give a clue as to what you need to answer).
This means that even if the economy enters a recession, prices of inputs and wages of workers will not adjust downward. This suggests the SRAS is HORIZONTAL over a long range of production.
So a recession will be the result of...

...deficient AGGREGATE DEMAND (AD). See the graph below. We now have a Recessionary Gap at "RGDP 1".
So what is the only way to get back to Full Employment?
Prop up AD with (1) automatic stabilizers that are already in place (unemployment compensation, food/housing assistance, etc) and (2) Fiscal Policy initiatives such as discretionary government spending and/or decreases in taxes. This would be considered "expansionary Fiscal Policy" intended to increase AD (shift to the RIGHT) in order to get back to Full Employment.

Full Stop on the Keynesian Model. Not lets look at the Classical Model.
 Let's start over with our original model seen below. Here is where you need to concentrate because the graph gets unavoidably messy.
Notice the construction of the SRAS curve in this model. The sloping, intermediate range of the SRAS curve is essential in the Classical Model.
As you move along the Intermediate Range you notice Price Level changes are every level of RGDP.
This suggests that "Prices and Wages" are "FLEXIBLE" (Key word you are likely to see on the AP test is "flexible").

As with the Keynesian Model a recession can be caused by a deficiency in Aggregate Demand (AD).
This is shown in the graph below. We have a Recessionary Gap at "RGDP 1", Point "B".

Notice Price Level Decreases AND unemployment INCREASES.
Here is the reasoning as to what the Classical Model suggests will happen in, but in a LONGER time frame:
1. Input prices are flexible. When there is slack demand for available resources use in the production of goods, then those prices will DECREASE.
2. Wages are flexible. When Unemployment increases then wages workers are willing to work for DECREASE.
3. Input prices and wages are elements for the cost of producing goods. If input prices decreases then the cost of producing decreases.
4. When the cost of producing decreases SRAS curve shifts to the RIGHT (See Graph below).
5. When SRAS curve shifts Right, then the economy returns to Full Employment at a LOWER Price Level and a HIGHER level of RGDP---POINT "C".
6. This is a longer term solution to return to Full Employment than the Keynesian approach.

That is a simple as I can make it and it will, I believe, help you get the points on the AP test for this concept.
Good Luck.
Here are some slides and in-between them some explanation. Hope it helps someone out there.

Here is the basic AD/SRAS/LRAS showing the economy at Full-Employment. All the curves intersect at the same sweet spot. This is what you draw if asked on the AP FRQ portion of the test. However....

If you are asked about the "Keynesian Range" of the SRAS curve then you have to look at it like the graph below. The Keynesian Model assumes "Sticky Prices and Wages" (this is usually a key phrase used on the test to give a clue as to what you need to answer).
This means that even if the economy enters a recession, prices of inputs and wages of workers will not adjust downward. This suggests the SRAS is HORIZONTAL over a long range of production.
So a recession will be the result of...
...deficient AGGREGATE DEMAND (AD). See the graph below. We now have a Recessionary Gap at "RGDP 1".
So what is the only way to get back to Full Employment?
Prop up AD with (1) automatic stabilizers that are already in place (unemployment compensation, food/housing assistance, etc) and (2) Fiscal Policy initiatives such as discretionary government spending and/or decreases in taxes. This would be considered "expansionary Fiscal Policy" intended to increase AD (shift to the RIGHT) in order to get back to Full Employment.

Full Stop on the Keynesian Model. Not lets look at the Classical Model.

Notice the construction of the SRAS curve in this model. The sloping, intermediate range of the SRAS curve is essential in the Classical Model.
As you move along the Intermediate Range you notice Price Level changes are every level of RGDP.
This suggests that "Prices and Wages" are "FLEXIBLE" (Key word you are likely to see on the AP test is "flexible").

As with the Keynesian Model a recession can be caused by a deficiency in Aggregate Demand (AD).
This is shown in the graph below. We have a Recessionary Gap at "RGDP 1", Point "B".

Notice Price Level Decreases AND unemployment INCREASES.
Here is the reasoning as to what the Classical Model suggests will happen in, but in a LONGER time frame:
1. Input prices are flexible. When there is slack demand for available resources use in the production of goods, then those prices will DECREASE.
2. Wages are flexible. When Unemployment increases then wages workers are willing to work for DECREASE.
3. Input prices and wages are elements for the cost of producing goods. If input prices decreases then the cost of producing decreases.
4. When the cost of producing decreases SRAS curve shifts to the RIGHT (See Graph below).
5. When SRAS curve shifts Right, then the economy returns to Full Employment at a LOWER Price Level and a HIGHER level of RGDP---POINT "C".
6. This is a longer term solution to return to Full Employment than the Keynesian approach.

That is a simple as I can make it and it will, I believe, help you get the points on the AP test for this concept.
Good Luck.
Monday, October 31, 2016
Keynesian Multipliers Made Easy. Ok, maybe a little less hard is a better way to put it.
The Keynesian Multipliers, both the Govt/Investment and Tax Multipliers, can be a tricky concept. I am going to TRY to simplify it as much as possible.
The Government/Investment multiplier is used when either Government and/or a Business increases or decreases expenditures. It will tell us by how much GDP will increase/decrease given the eventual multiplier effect.
The Government or Investment Multiplier is determined by the simple equation:
Example: If the MPS is 25% (.25) then the MPC (Marginal Propensity to Spend) is 75% (.75).
So, if Govt or a Business increases spending by +$100.00 then the eventual impact on GDP will be +$400.00 (+$100 X +4). Easy, right?
The Tax Multiplier formula is a bit different and this is the one that usually confuses students.
The Tax Multiplier equation is:
If the Government wants to INCREASE GDP through tax policy, then it wants to CUT or DECREASE TAXES. This will be a NEGATIVE amount from the Government's perspective.
If we multiply and Negative by a Negative we get a Positive, right?
So, if Government cut or decreased taxes by $100, then -$100 X -3 = +$300 INCREASE in GDP.
IMPORTANT POINT #1: Notice we use the same Marginal Propensities in both cases, MPC or 75% and MPC of 25%. We also use the same initial amount for "stimulus"---$100.
But we produced 2 different outcomes in terms of increasing GDP.
Government Spending that $100 produced $400 in GDP but the Tax Cut to individuals produced only an increase of $300 in GDP.
If you are a policy-maker and your charge is to get the economy going as quickly as possible and you had to choose only one of the above, which option is optimal, ceteris paribus?
IMPORTANT POINT #2: Why is there a difference between the two multipliers? Notice the Government Multiplier is "4" and the Tax Multiplier "-3". Ignore the "-" sign in front of the 3, it is not important for this part.
The difference between the two numbers is "1". The Government Multiplier is ALWAYS going to be one more than the Tax Multiplier (go ahead, using the formulas above change the MPS to 1%, 10%, 20%, 50% try it. You will get a difference of 1 EVERY TIME).
The difference is derived in the FIRST ROUND OF SPENDING. In the first round of spending it is assumed the Government DOES NOT save any of the $100. The economy benefits by $100 immediately.
In the case of the Tax Cut it is assumed that the individual will SAVE a portion of that $100---25%.
So, in that first round of spending the economy benefits by only $75. Twenty-five dollar less!
All of the above is predicated on the $100 being borrowed, whether it is for the government spending or for the tax cut. Either way, it will create a BUDGET DEFICIT.
The "Third Leg" of the Keynesian Multipliers is something called the "Balanced Budget Multiplier". This is how Keynes suggested a balanced budget could be maintained AND the economy can be stimulated. FUN STUFF!!
I will let you digest the lesson above and get busy writing the lesson for that to come soon.
I hope this helps.
The Government/Investment multiplier is used when either Government and/or a Business increases or decreases expenditures. It will tell us by how much GDP will increase/decrease given the eventual multiplier effect.
The Government or Investment Multiplier is determined by the simple equation:
1/MPS.
MPS is the "Marginal Propensity to Save" each additional dollar.Example: If the MPS is 25% (.25) then the MPC (Marginal Propensity to Spend) is 75% (.75).
Remember: MPC + MPS = 100% (or +1)
1/25% = 1/.25 = +4.
This means each additional dollar spent by either the Government or a Business will create, by the multiplier effect, +$4.00 in GDP in total (this includes the $1.00 originally spent too).So, if Govt or a Business increases spending by +$100.00 then the eventual impact on GDP will be +$400.00 (+$100 X +4). Easy, right?
The Tax Multiplier formula is a bit different and this is the one that usually confuses students.
The Tax Multiplier equation is:
-MPC/MPS.
Using the same Propensity numbers from our first example, we plug them into the equation:
-75%/25% = -.75/25 = -3.
This is where it gets tricky---Notice the negative sign in front of the 3.
If the Government wants to INCREASE GDP through tax policy, then it wants to CUT or DECREASE TAXES. This will be a NEGATIVE amount from the Government's perspective.
If we multiply and Negative by a Negative we get a Positive, right?
So, if Government cut or decreased taxes by $100, then -$100 X -3 = +$300 INCREASE in GDP.
IMPORTANT POINT #1: Notice we use the same Marginal Propensities in both cases, MPC or 75% and MPC of 25%. We also use the same initial amount for "stimulus"---$100.
But we produced 2 different outcomes in terms of increasing GDP.
Government Spending that $100 produced $400 in GDP but the Tax Cut to individuals produced only an increase of $300 in GDP.
If you are a policy-maker and your charge is to get the economy going as quickly as possible and you had to choose only one of the above, which option is optimal, ceteris paribus?
IMPORTANT POINT #2: Why is there a difference between the two multipliers? Notice the Government Multiplier is "4" and the Tax Multiplier "-3". Ignore the "-" sign in front of the 3, it is not important for this part.
The difference between the two numbers is "1". The Government Multiplier is ALWAYS going to be one more than the Tax Multiplier (go ahead, using the formulas above change the MPS to 1%, 10%, 20%, 50% try it. You will get a difference of 1 EVERY TIME).
The difference is derived in the FIRST ROUND OF SPENDING. In the first round of spending it is assumed the Government DOES NOT save any of the $100. The economy benefits by $100 immediately.
In the case of the Tax Cut it is assumed that the individual will SAVE a portion of that $100---25%.
So, in that first round of spending the economy benefits by only $75. Twenty-five dollar less!
All of the above is predicated on the $100 being borrowed, whether it is for the government spending or for the tax cut. Either way, it will create a BUDGET DEFICIT.
The "Third Leg" of the Keynesian Multipliers is something called the "Balanced Budget Multiplier". This is how Keynes suggested a balanced budget could be maintained AND the economy can be stimulated. FUN STUFF!!
I will let you digest the lesson above and get busy writing the lesson for that to come soon.
I hope this helps.
Saturday, August 4, 2012
Keynesian Economics vs Classical Economics summed up in two easy memes...
Keynesian vs Classical---in a nutshell...
 |
| Source: The Big Picture Blog |
 |
| Source: Haywardeconblog ---I changed the captions. Did not create the picture |
Cartoon " Desert Island Recession"---See if you agree with the premise and conclusion...
The genesis of a recession. I have a problem beginning with the frame "The Next Day". How about you?
From Gocomics Via Mike Norman

From Gocomics Via Mike Norman

Sunday, May 8, 2011
Sunday, October 24, 2010
Excellent defense of the Keynesian point of view on how to "prime the pump" of the economy..
This is an excellent defense of the Keynesian point of view on how to deal with an economy at less than full-employment. Notice it has MANY of the elements of Fiscal Policy we have covered recently in class and a couple we will cover this week, i.e. "the crowding out effect" of government borrowing. It also provides an nice seque into Monetary Policy, which we will start in Week 11. The script of the textbook is playing out on the stage of life so we can observe it, applaud it, or pan it...A bad time for the economy, but a good time for critical observers like me---and YOU! :)
NYTIMES: Now is not the time to cut the budget deficit by Christine Romer (former Obama Admin Chief Economist)
NYTIMES: Now is not the time to cut the budget deficit by Christine Romer (former Obama Admin Chief Economist)
""THE clamor to cut the budget deficit is deafening.... Make no mistake: persistent large budget deficits are a significant problem. Government borrowing in good times crowds out private investment and lowers long-run growth.... So the question is not whether we need to reduce our deficit. Of course we do. The question is when.HT: Grasping Reality with Both Hands
Now is not the time. Unemployment is still near 10 percent.... Tax cuts and spending increases stimulate demand and raise output and employment; tax increases and spending cuts have the opposite effect. This is a basic message of macroeconomics and a central feature of public- and private-sector forecasting models. Immediate moves to lower the deficit substantially would likely result in a 1937-like “double dip” as we struggle to recover from the Great Recession.
Some advocates of austerity argue that, contrary to the conventional view, fiscal tightening now would lower long-term interest rates and improve confidence so much that the impact could be positive. But an ambitious new study in the World Economic Outlook of the International Monetary Fund confirms that fiscal consolidations — that is, deliberate deficit reductions — typically reduce growth.... The recent experience of countries already carrying out austerity measures is consistent with the central finding of the I.M.F. study. Ireland, Greece and Spain have all had rising unemployment after moving to cut deficits....
But once the economy has substantially recovered, the Federal Reserve will be ready to raise interest rates. At that point, the Fed could help maintain growth by instead continuing very low rates as the deficit is reduced. Waiting for conventional monetary policy to be back on line is like waiting for the anesthesiologist to arrive before doing surgery.
True believers might say we should never wait, because a slow-growing tumor could turn virulent. But we need to think about actual risks. Today, markets are willing to lend to the American government at the lowest 20-year interest rate since 1958. In the crisis of 2008 and 2009, money flowed to the United States because it was seen as the safest spot in the storm. There is no evidence that we have to act immediately.
Countries that enjoy the markets’ confidence have another reason to wait. Greece and other troubled nations on the periphery of the euro zone can no longer borrow at affordable rates. They must immediately cut expenditures and raise taxes, despite the terrible toll on employment and output. Countries like the United States, Germany and France can play an essential role as sources of growth and demand for the world economy. Strengthening our economies will help keep the world from slipping into another recession, and allow for continued healing of vulnerable financial markets here and abroad....
The best thing would be for Congress to pass a plan now that will reduce deficits when the economy is back to normal.... History shows that well-designed backloaded plans are credible. For example, changes to Social Security eligibility and taxes have been passed years, if not decades, before they took effect. And in an environment like today’s, when Congress has again agreed to pay-as-you-go rules, deviating from planned reforms forces countervailing actions. Such backloaded deficit reduction would not hurt growth in the short run — and could raise it. If uncertainty about future budget policy is harming confidence, as some business leaders suggest, spelling out future spending and tax changes could be helpful...""
Subscribe to:
Posts (Atom)
 View My Stats