Showing posts with label Economic Profit. Show all posts

Thursday, September 25, 2014

Corn prices down. My graphs showing how this affects the farmer (AP Micro)

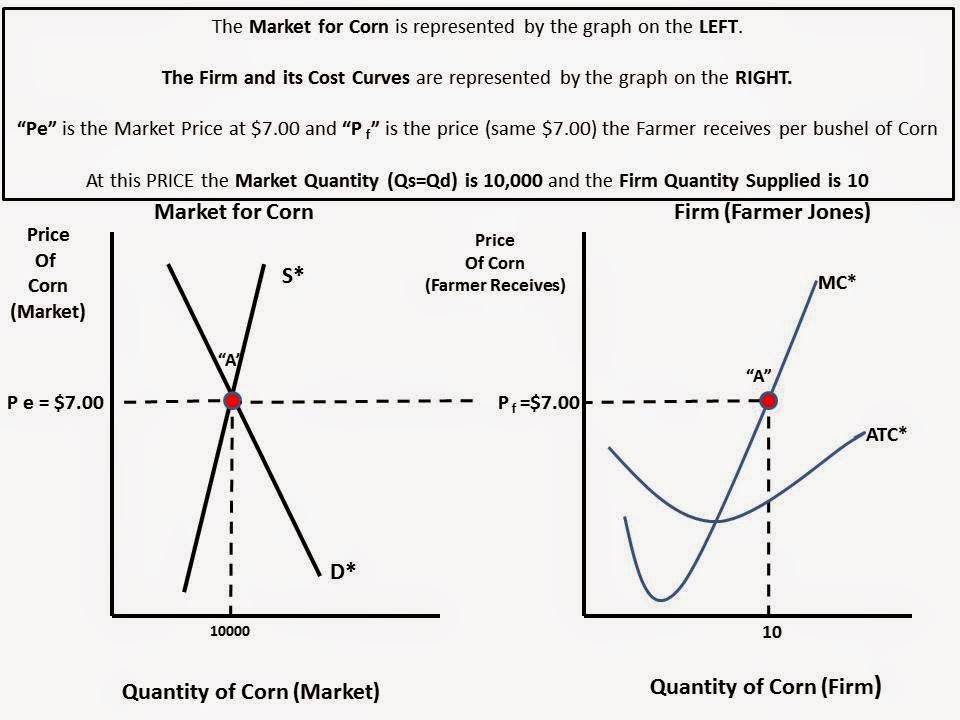
A current event gives me an opportunity to create a series of graphs to illustrate what happens to "Economic Profits"in a market that is considered "Perfectly Competitive" when there is a price decrease AND the cost structure remains relatively constant.
Ohio corn farmers might be producing more crops, but the boom in supply and higher expenses are driving down profits this year. 
Most farmers are reporting they are producing more bushels this year, but the price they're able to get for the commodity has been roughly cut in half compared to last year. 
Western Ohio farmer Tom Tullis said he regularly saw corn prices as high as $6.50 or $7 per bushel as late as last year. But prices this year have been closer to $3. At the same time, operating costs such as machinery and fertilizer have remained high. (Note: I read that "constant")
"It's about half price or below what it was last year," Tullis told the Dayton Daily News (http://bit.ly/1uwu8jN ). "And our inputs are staying pretty much in the same place as far as fertilizer, chemicals and everything else. It's going to be a tough one." 
Most farmers will have enough assets to withstand a tough year or two, said Matt Roberts, an agricultural economist for Ohio State University Extension. The majority of farmers across the state will likely break even this year, Roberts said, although there will be some who lose money."
In the graphs below, I use $7.00 as last years price and $3.50 as this years price.  I use $3.50 as the Average Total Cost (ATC) of producing because it is suggested in the article that farmers are either making a small profit at that level or might even be losing money at that cost. In other words, it is the rough "break-even" point.


Friday, June 13, 2014

Corn, Wheat and Soybeans OH MY! I calculate "Economic Profit" for each. See which one gets planted.

In my last posting (HERE) I used USDA cost and crop yield data to show the different costs per bushel a farmer faces when choosing to produce Corn, Soybean or Wheat.  I balanced that against the Price Floor for each crop as established by the 2014 Farm Bill ("PLC or "Price Loss Coverage" provision) to show that the price floor amounts were enough to cover all the farmers Variable Costs but only some of the Fixed Costs. Please re-read that post for more clarification.

In this posting, I want to compare the two different cost numbers I calculated to the current market price for the respective commodity.  I used the table below from the USDA to show costs per acre for each crop.


The USDA projects yields for each of these crops to be (in 2013-14):

   Corn: 165 bushels per acre.
   Soybean: 43 bushels per acre.
   Wheat: 47 bushels per acre.

If we divide these projected bushels per acre into the "TOTAL ALLOCATED COSTS " (Variable PLUS Fixed and Opportunity Costs) for each commodity we will arrive at a "Cost per Bushel" for growing each of these crops:

    Corn: $4.18
    Soybean: 11.10
    Wheat: $6.78

If we divide the projected bushels per acre into just the "TOTAL OPERATING COSTS", or ONLY the Variable Costs then the cost per bushel would be:

Corn: $2.19
Soybean: $4.27
Wheat: $2.77

Here are the current market prices (per bushel) for these crops according to Agriculture.com:


The prices are highlighted in YELLOW and you should read them as follows:

Corn: $4.47 
Soybeans: $12.21 
Wheat: $5.86 

If we subtract "TOTAL ALLOCATED COSTS" from the market prices we find:

Corn yields an "Economic Profit" of $.29 per bushel
Soybean yields an "Economic Profit"of $1.11 per bushel
Wheat yields an "Economic LOSS" of $.92 per bushel

Result?

This year (2014) the projected plantings for:

     Wheat down 347,000 acres
     Corn down 3,674,000 acres
     Soybean UP 4,960,000 acres (yes, that is almost 5 million acres)

At $1.11 per bushel in potential "economic profit" the market has reallocated agricultural resources suitable to produce corn, wheat or soybean to its highest (or higher) value commodity.

As always, constructive comments on methodology are welcome.
View My Stats