Showing posts with label Agriculture. Show all posts

Wednesday, August 17, 2016

Market for Irish Cattle---Change in Quantity Supplied vs Change in Supply

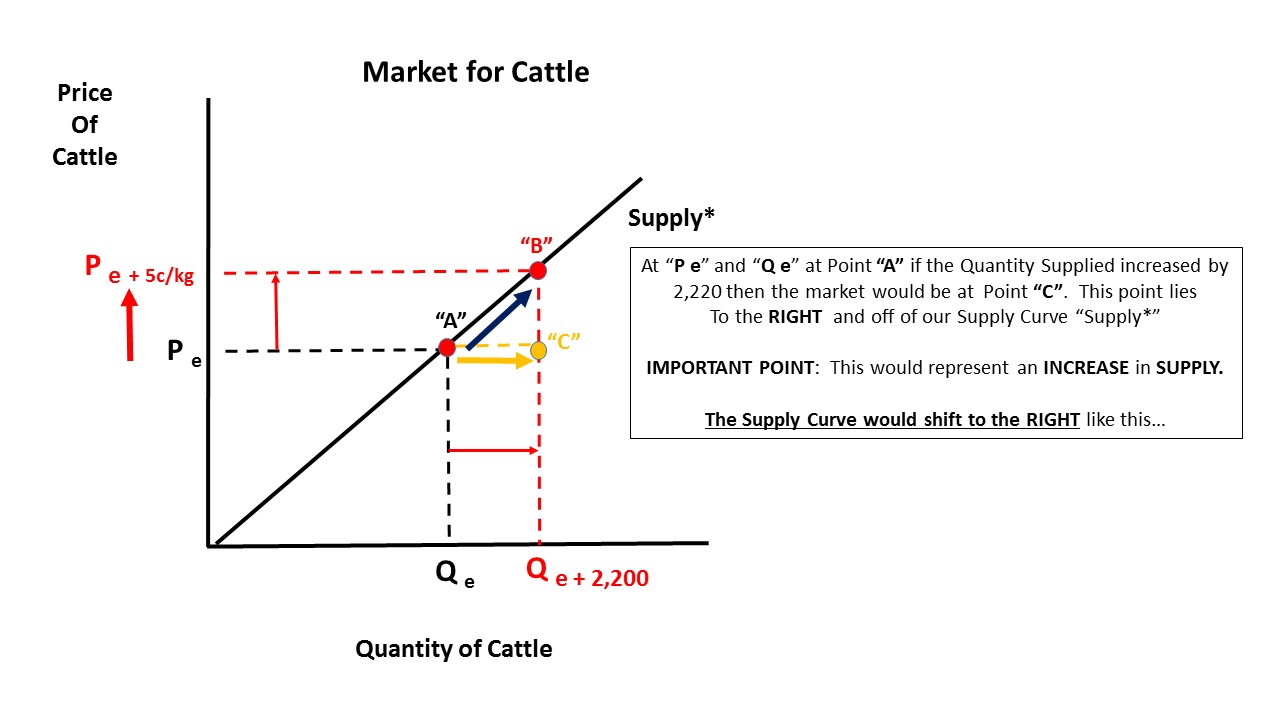
One of the most frustrating things to teach AND learn in a basic microeconomics class is the difference between a change in Quantity Demanded and/or Supply and a change in Demand and/or Supply---whether we move along the respectived curve or the curve shifts entirely in one direction or the other.

This very short article from a website that reports on agricultural issues in Ireland provides a nice example on the supply side to illustrate the difference:
The number of prime cattle slaughtered at Department of Agriculture approved beef export plants has jumped 10% in the space of a week. 
Figures from the Department show that the throughput of young bulls, steers and heifers increased by just over 2,200 head last week compared to the week before. 
Towards the end of last week and into this week, factory buyers were willing to pay an extra 5c/kg on top of the base price in order to secure stock.And this move appears to have worked, as an additional 2,285 cattle were presented for slaughter during the week ending August 14.
Here are some slides that will help explain the difference. Hope it helps!


Wednesday, August 27, 2014

Fuel for Food in the Upper Mid-West. Caught in the Opportunity Cost trap.

The allocation of scarce railroad track from the transport of food to fuel has created a costly consequence for agricultural interests. The simultaneous boom in energy and food production necessitates choices.  It appears the fossil fuel (oil and gas) interests are winning out.  There is no escaping Opportunity Costs!

Millions in Agriculture Lost as Rails Neglect Grain Surplus (HT Morning Ag Cllips)

Farmers in North Dakota are experiencing millions of dollars in losses as their grain shipments — held up by rails’ prioritization of the transport of oil — have no way of getting to the companies that need them, like cereal producer General Mills. Production at such companies has slowed, and the grain, with nowhere to go, “is simply going to ground and rot,” farmer Bill Hejl told The New York Times. 
What’s more, farmers expect that the upcoming harvest will yield a record crop of wheat and soybeans, meaning that this problem is only expected to get worse. 
Farmers have long relied on railroads, “the backbone of North Dakota’s transportation system,” to help them move their crops across the country, and abroad. 
But lately, the region’s railroads are occupied by shipments of oil, which, along with gas, have become biggest contributor to North Dakota’s gross domestic product. As of August 22, reports indicate that the Burlington Northern Santa Fe Railway (the state’s largest railroad) had a backlog of 1,336 rail cars waiting to ship grain, while Canadian Pacific railroad had a backlog of 1,000 cars.

Friday, August 1, 2014

It takes a nation to stockpile this much ethanol. No lie. It literally takes a nation. Find out which one here.

US ethanol stocks soar to 16-month high: EIA

US ethanol stocks rose 647,000 barrels to a 16-month high of 18.587 million barrels in the week that ended July 25 despite a slight decline in US ethanol production, which dipped 5,000 b/d to 954,000 b/d, US Energy Information Administration data showed Wednesday.
 As I like to do, I will put this into some perspective.

18.587 million barrels of ethanol equals 780,654,000 gallons of ethanol (42 gallons in a barrel).

One bushel of corn (56 pounds) produces 2.8 gallons of ethanol.

So, it took 278,805,000 bushels of corn (780,654,000/2.8) to produce the 18.587 million barrels of ethanol the US has in stock.

The stock of ethanol was produced from multiple corn plantings over time, so in many cases the same acreage was used to produce multiple harvests of corn.

In 2013, the average yield of corn per acre was 158 bushels.

This means, in the aggregate, the number of acres of corn needed to produce the current stock of ethanol was 1,764,588 (278,805,000/158).

How much is that? The total acreage of the US is 1,875,714. Virtually the whole US minus a couple of counties.

How many people could that feed?  Just askin'...

Note: Please remember my caveat---the same land would have to be used multiple times to get this amount of ethanol over time. I am not saying it literally takes the whole country.  Thanks!

Corn killed Bubba Gump Shrimp. "That's all I have to say about that". See how here.

Source: Big Picture Agriculture


Kay MacDonald over at Big Picture Agriculture has this graphic showing the "Dead Zone" in the Gulf of Mexico just off the coasts of Texas and Louisiana and the following comment:

"This year’s Deadzone in our Gulf of Mexico waters will be about the size of Connecticut. It is estimated that the Dead Zone causes losses of $82 million per year to the seafood and tourism industries. 
Much of it is caused by corn cropland fertilizer runoff that ends up going down the Mississippi River. Corn used to fuel cars – cropland used to feed cars, not people. In contrast, a healthy Gulf of Mexico sans Dead Zone would be capable of growing more shrimp, crabs, clams, and fish which humans love to eat."
This clearly illustrates an important concept in AP Microeconomics: Negative Externality.

Negative externalities occur when the production of a good imposes a cost (or costs) on third parties not involved in producing or consuming the good.

Farmers grow corn. The fertilizer used in the process becomes part of the run-off from irrigation and/or rains that make their way to streams and rivers then eventually the Gulf of Mexico in this instance.  The chemicals in the fertilizer destroy/damage the aquatic ecosystem that allow shrimp and other sea creatures to thrive.

Each farmers contribution to the problem is small but in the aggregate all farmers along the waterways that feed the Gulf of Mexico cause approximately $82 million dollars in lost revenues to fisherman of all types along the Gulf Coast.

This loss in revenue (a cost) is borne by the fisherman ("Third Parties") and not by the farmers and/or consumers of corn.

There are potentially 3 solutions to this problem:

(1) tax the producers and/or consumers of corn up to at least the amount of the damage--$82 million.
(2) impose a regulation forcing farmers to prevent the run-off hence the damage to the Gulf
(3) Farmers collectively agree to pay the fisherman $82 million for the damage they cause ("Coase" solution).

All 3 of these "internalize" the monetary value of externality and require the parties to the actual transaction to bear the full cost of the damage they impose.

Seems fair, doesn't it?

Thursday, June 19, 2014

Ever wonder how farmers get paid for not planting crops? Here is my explanation as it pertains to the new farm bill. Enlightening...

I have been semi-immersing myself in learning about the new Farm Bill that was recently passed and signed into law that will dictate US farm policy for the next 5 years.

I even attended an online seminar sponsored by the US Dept of Agriculture whose target audience was farmers who wanted to learn more about the changes in the law.  It is complex and if you want to learn more yourself, please go HERE for all you can consume.

Here is an interesting tidbit I learned I cannot get my mind wrapped around.  Very strange, in my opinion.

Say I am a farmer and have 1000 acres of land suitable for growing Wheat or Soybeans.  Assume my planting history shows I use 500 acres for wheat and 500 acres for soybeans.

For the purposes of satisfying the requirements of the Farm Bill, this 50/50 allocation of acres is what I declare as my "Base Acres" for claiming subsidies or any other government program for which I may be entitled.  So far so good.

Now, suppose next year I KNOW the price of soybean per bushel is going to be high and the price of wheat per bushel is going to be low---very low.  So low, in fact, it will be lower than the legal PRICE FLOOR that was set in the Farm Bill.  According to the Farm Bill, if the market price is below the Price Floor set in by the Farm Bill I am entitled to a payment (or subsidy) equal to the difference between the two prices PER BUSHEL of the crop---in this case wheat.

Here is what I am going to do:  Not plant ANY wheat and plant 1,000 acres of soybeans. Yes, can do that even though I have declared a 50/50 split based on historical plantings

I am going to sell my 1,000 acre harvest of soybeans for the high market price.  GOOD FOR ME, RIGHT?

It gets better.

Subsidies are paid on declared BASE ACRES, not actual harvest of a crop.  Since 500 of my 1,000 acres are declared for wheat I can receive the subsidy for WHEAT on those 500 acres even though I grew NO WHEAT AT ALL.

So, based on average historical bushels of wheat per acre harvested, I will receive that number times the subsidy (the difference between the Price Floor and the actual market price for wheat at the time) times the number of acres.

If the subsidy is $1.00 and the average yield is 47 bushels per acre then that = $47.00 per acre. I have 500 base acres in wheat so $47.00 X 500 =  $23,500.  For growing no wheat.

I told you. Strange, right.

This is the way it was explained to me.  If I have any details wrong or there is more to the story let me know. Always open to revisions.

Note:  The average farm is much less than 1,000 acres and the subsidy payout is likely much LESS than $1.00 ( could be just pennies).  So both those numbers I used are, in most cases, over-stated.
Friday, June 13, 2014

Corn, Wheat and Soybeans OH MY! I calculate "Economic Profit" for each. See which one gets planted.

In my last posting (HERE) I used USDA cost and crop yield data to show the different costs per bushel a farmer faces when choosing to produce Corn, Soybean or Wheat.  I balanced that against the Price Floor for each crop as established by the 2014 Farm Bill ("PLC or "Price Loss Coverage" provision) to show that the price floor amounts were enough to cover all the farmers Variable Costs but only some of the Fixed Costs. Please re-read that post for more clarification.

In this posting, I want to compare the two different cost numbers I calculated to the current market price for the respective commodity.  I used the table below from the USDA to show costs per acre for each crop.


The USDA projects yields for each of these crops to be (in 2013-14):

   Corn: 165 bushels per acre.
   Soybean: 43 bushels per acre.
   Wheat: 47 bushels per acre.

If we divide these projected bushels per acre into the "TOTAL ALLOCATED COSTS " (Variable PLUS Fixed and Opportunity Costs) for each commodity we will arrive at a "Cost per Bushel" for growing each of these crops:

    Corn: $4.18
    Soybean: 11.10
    Wheat: $6.78

If we divide the projected bushels per acre into just the "TOTAL OPERATING COSTS", or ONLY the Variable Costs then the cost per bushel would be:

Corn: $2.19
Soybean: $4.27
Wheat: $2.77

Here are the current market prices (per bushel) for these crops according to Agriculture.com:


The prices are highlighted in YELLOW and you should read them as follows:

Corn: $4.47 
Soybeans: $12.21 
Wheat: $5.86 

If we subtract "TOTAL ALLOCATED COSTS" from the market prices we find:

Corn yields an "Economic Profit" of $.29 per bushel
Soybean yields an "Economic Profit"of $1.11 per bushel
Wheat yields an "Economic LOSS" of $.92 per bushel

Result?

This year (2014) the projected plantings for:

     Wheat down 347,000 acres
     Corn down 3,674,000 acres
     Soybean UP 4,960,000 acres (yes, that is almost 5 million acres)

At $1.11 per bushel in potential "economic profit" the market has reallocated agricultural resources suitable to produce corn, wheat or soybean to its highest (or higher) value commodity.

As always, constructive comments on methodology are welcome.

Friday, May 16, 2014

Where's the Beef? No, seriously, where is the beef!!

Here is a look at the past, present and future of the Supply Side of the meat industry. This data is from the USDA ERS for the years 2013, 2014 and 2015. Part of 2014 and all of 2015 are predictions based on known numbers in the herds, flocks, whatever. Numbers are in "millions".

Here are the percentage changes, from 2012 to 2015 in the potential "Quantity Supplied" (in millions of pounds of meat) of meat for consumption:

Beef:  -6.2%
Pork: +4.5%
Lamb/Mutton: -5.8%
Broilers (chickens): +6%
Turkeys: -.7%

Beef production has experienced a steady decline since 2012.  Pork is still below 2012 production levels but expected to rebound in 2015.  Chicken is a bright spot in that it has increased at a fairly steady rate.

While the supplies of chicken and pork will increase, prices will not likely decrease as you might expect.  As the price of beef is most assuredly going to be higher, the demand for chicken and pork as viable substitutes will increase and put upward pressure on the price of  both of those meats.

TANSTAAFL---Now I am hungry for lunch.  Will it be Chicken or Pork Fried Rice?

Thursday, May 15, 2014

GUESS FIRST! Which State produces almost half of all rice grown in the US?? Ok, now you can read on...

After attending my daughters graduation from Texas A&M (economics!!) we drove from College Station to our home in the Columbus, Ohio area.

As much as time allows, I like to stay off the Interstate highways and drive the "country roads" to see places I have never been before.  This is where "America" happens.  Love to have those forehead thumping moments when I learn something I did not know before.

Rice.is.grown.in.Arkansas!  (Head Thump!) Hate to admit it but I did not know that.  I assumed Louisiana and Mississippi had the comparative advantage of the proper land resource needed to grow it on a mass scale.

Much to may amazement, I saw unfamiliar field after field like this:

Source: HERE (for some reason I did not bother to stop and take my own picture!!

I have been to Arkansas but never East of Little Rock.  The map below highlights in GREEN the areas of heavy concentration of rice production.  You can see lots of dark green that lies just to the West of the Mississippi River into Arkansas.

Source: Wikipedia
Below is data on rice production in the US by State from 2007 to 2013.

On average over that time span, Arkansas alone produced 46% of the US Rice crop.

Source: USDA ERS

It was not inevitable that Arkansas would become the rice capital of the US.

Here is the story of how it happened (from Arkansas Rice Facts):
Growers in the prairie lands of Arkansas were in need of a crop that could be grown dependably and profitably. Almost by accident, rice became a contender when in 1896, W.H. Fuller ventured southwest to Louisiana on a hunting trip. It was there that he first saw rice growing, which ultimately led to the development of a leading agricultural industry for the state. Fuller, along with his brother-in-law John Morris and John’s wife Emma, are generally credited with founding the Arkansas rice industry. By 1910, rice production, research and milling were established in the state. Today, the Museum of the Arkansas Grand Prairie in Stuttgart, Arkansas, showcases the history of this major center for U.S. rice production.
Now you know it too.

Guess it will be chicken fried rice for lunch today...

Monday, May 5, 2014

PPF illustration with maps of Corn and Soybean acreage. Nice real life example.

In the first week of an introductory Economics students encounter the Production Possibilities Frontier (PPF) as the first formal model used in both Micro and Macroeconomics.

The PPF illustrates the productive capacity of an economy if it were fully-employing all of its useful resources (Land, Labor, Capital, Entrepreneurship). The model is flexible and can be used in a Macro sense comparing the production of the broad categories of Capital and Consumer Goods or in a Micro sense comparing the production of two specific goods such as Corn and Soybeans.

If the economy is producing ON (does not matter where) the PPF it is achieving "Productive Efficiency". This means it is fully utilizing its productive resources in the the most efficient and lowest cost way.

WHERE on the PPF, or the particular bundle of the two goods, the economy produces is called "Allocative Efficiency".  That bundle a society produces and consumes is determined by the economic system (market vs socialist vs command) or some combination thereof.  In the US, the price mechanism and/or government policy determines the Allocatively Efficient bundle of goods in the market place.

Nowhere is this more evident than in Agriculture.

Let's look at the two-good model---Corn and Soybeans.

Both require roughly the same climate, terrain and soil to grow.  The Opportunity Cost of switching from growing one to the other is minimal--an acre of land for growing corn will produce a maximum yield in either corn or soybeans.

So, our PFF for Corn and Soybeans, shown below, illustrating the trade-off between growing one or the other would be a straight line representing "constant opportunity costs".  Assume our initial equilibrium point in the year 2001 was at combination of Corn and Soybean planted and harvested acreage---Point "A".


However, in the mid-2000's due to a policy change we had a relatively massive "Allocative Efficiency" change and a re-allocation of land resource from the production of Soybeans to Corn--Point "A" to Point "B".  How do I know this?

See the map below.  The RED areas on the map on the left show the DECREASE in acreage planted for Soybeans and the BLUE areas on the right map show the INCREASE in acreage planted to Corn.

Matches up pretty well, wouldn't you say?

Source:  From USDA Atlas Maps

What was the major the policy change that prompted this reallocation?  I will just leave you with a picture to ponder that one...


Wednesday, July 25, 2012

Side by side comparison of drought conditions---today and 1934, a Dust Bowl year....

Here are side by side comparisons of drought conditions today and 1934, a Dust Bowl year.

A stark reminder of how bad the conditions really were back then.  Keep in mind how much MORE the average person depended on agriculture (directly or indirectly) as compared to today.  I look at this and can feel their fear!!
Source: USA Today
View My Stats