In today's Wall Street Journal there is an
article on the state of the world wide luxury goods market.
In my opinion they make LOTS of Microeconomics 101 (or AP Microeconomics) mistakes in their analysis. Read for yourself but I want to focus on how they use, or misuse, the term "Giffen Good". Here is the relevant excerpt:
"...An economic theory holds that for certain goods, higher prices increase desirability and drive sales, rather than suppress demand as they would for ordinary products. Economists refer to such luxury products as Giffen goods, named for Scottish economist Robert Giffen, who described the phenomenon...."
First, they REALLY should have used the term Veblen Good instead of a Giffen Good. A Veblen Good refers to luxuries ("status or pretige goods") and a Giffen Good is used generally in the context of inferior goods.
Here is a definition I found that I REALLY like and makes the concept easier for me to understand:
"We use the term “Giffen behavior” rather than “Giffen good” to emphasize that the Giffen property is one that holds for particular consumers in a particular situation and therefore depends on, among other things, prices and wealth. Thus, it is not the good that is Giffen, but the consumers’ behavior. The Giffen phenomenon should also not be confused with prestige or Veblen goods, where consumers desire the goods precisely because the price is high, “snob appeal,” where consumers desire the good because it is rare, or situations where consumers interpret a high price as a signal of high quality. In all three cases, the goods in question are normal. Giffen behavior is a phenomenon that arises entirely within the neoclassical framework where consumers care about price only inasmuch as it affects their budget sets. If demand is Giffen the good in question must also be inferior, which rules out Veblen, snob and signaling effects". ---LINK HERE to where I got this definition.
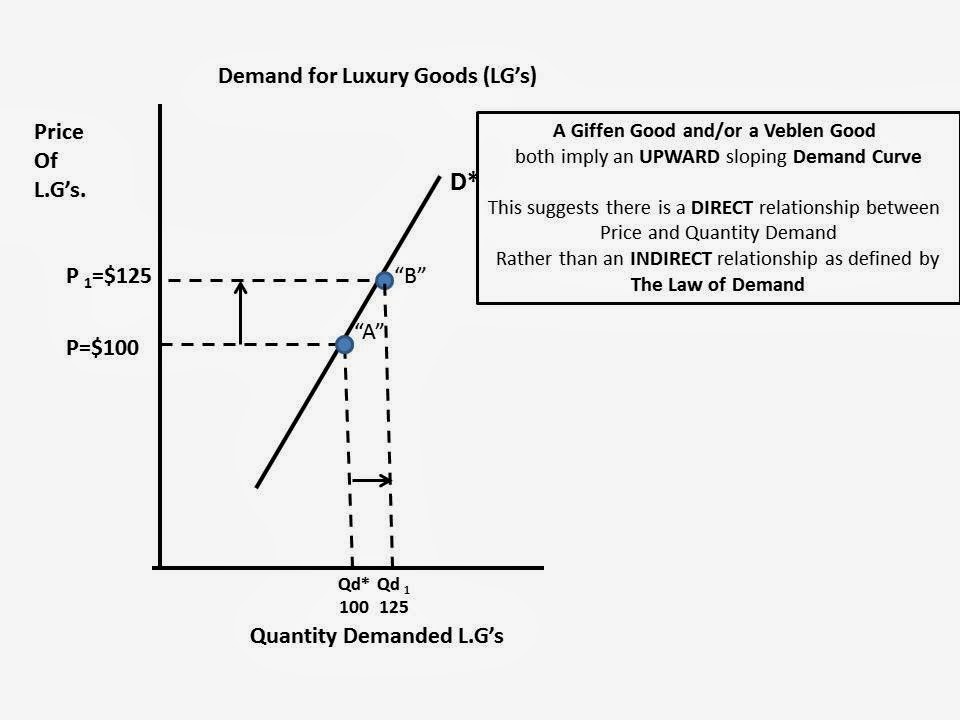
In both cases it suggests the Market Demand Curve is UPWARD sloping, indicating there is a DIRECT relationship between Price and Quantity Demanded of a good. In other words, we only buy MORE when the price increases (or buy less when the price decreases). This graph illustrates this phenomena:
This is counter to the Law of Demand that indicates we buy more only when the price decreases (or less when the price decreases).
So, what is really going on in the Market for Luxury Goods that I believe maintains the integrity of the Law of Demand? Let's go to the graphs!
Here is a downward sloping Demand Curve for Luxury Goods. I just made up some random numbers for illustration purposes and to make the math easy.
At a price of $100 assume the market quantity demanded is 100. Total Revenue would be
$10,000
Assume the price of the Luxury Good increased to $125 and following the Law of Demand the Quantity Demanded decreases to 80. Even though price increased and quantity demanded decreases, Total Revenues stayed the same. This could or could not happen. It depends on "Elasticity of Demand", but I am not going to include that analysis here to keep it simple and short. :)
Why do I believe this is true in "Real Life". Well, because the article told me so, in TWO places:
(1)---One reason ultra luxury brands are raising prices is to distinguish their products from entry-level luxury goods that are fast picking up market share.
"The more Tory Burches and Michael Kors there are, the more the Chanels and Louis Vuittons will try to price up," said Milton Pedraza, the chief executive of the Luxury Institute, a research and consulting firm.
The unintended consequence could be that the luxury brands drive even more customers toward less-expensive rivals....
...(2)---Jamie Moore, a homemaker in Cleveland, Tenn., said that on her annual shopping sojourn to New York, she usually splurged on a Prada handbag, for which even a basic nylon model can cost $1,230. Not this year.
"The prices have gotten so expensive that I'm not buying one," she said.
So, a switch to an less expensive brand because of a viable substitute (1) AND because it is no longer affordable (2). Nice example of BOTH the "
Substitution AND Income Effects" that explain the DOWNWARD sloping nature of a demand curve...Hmmmm...
The article introduces two variables into the equation---rising income from China which creates new entrants into the market for Luxury Goods.
"A change in Income" and "A change in the Number of Buyers" are two determinants of demand that will shift our demand curve, either left or right.
If at the
SAME TIME there is a decrease in quantity demanded (20 units) from "the West" because of an increase in price, rising incomes and more Chinese wanting Luxury Goods can off-set this decrease in quantity demanded at $125.
Point "C" represents a new Price ($125) and Quantity Demanded (100) that lies to the RIGHT of the original Demand Curve "D*" (Price $125, Quantity Demanded 80).
We can assume (Ceterus Paribus) what happened between Point "B" and Point "C" will happen at
every other point along Demand Curve "D*. The Demand Curve will shift to Right:
Bottom line: I THINK I maintained the integrity of the Law of Demand within the context of the Wall Street Journal article and its suggestion there is a case of Giffen/Veblen Goods going on in the luxury goods market.
This is just one inconsistency I found in the article. I believe there are many more.
Extra Credit if you can find them!! :)







 View My Stats