Friday, October 10, 2014

The New UK Minimum Wage in current and PPP exchange rates compared to US Minimum Wage.

The UK has different minimum wages for different age groups and for those who are classified as "apprentices".

Th numbers below are from the UK.gov website.

The wages are in current, nominal British Pounds Sterling.  I highlighted the 2014 rate that took affect this month (October).


For comparison to the US minimum wage of $7.25 here are the conversions in current market exchange rates and in the Purchasing Power Parity (PPP) exchange rate.  Go HERE for an excellent explanation of PPP, if you need it.

Economists, in general, prefer the PPP exchange rate because it more accurately measures the actual purchasing power of currencies and is less volitile than the market exchange rates that can flucuate for transient reasons.

Current Market Exchange Rates (1 British Pound Sterling exchanges for $1.61 US dollars).

   21 and over: 6.50 Pounds X $1.61 = $10.47
   18-20 : 5.13 Pounds X $1.61 = $8.26
   Under 18: 3.79 Pounds X $1.61 = $6.10
   Apprentice: 2.73 Pouns X $1.61 = $4.40

Purchasing Power Parity (PPP) (1 British Pound Sterling exchanges for $1.36--source OECD)

   21 and over: 6.50 Pounds X $1.36 = $8.84
   18-20 : 5.13 Pounds X $1.36 = $6.98
   Under 18: 3.79 Pounds X $1.36 = $5.15
   Apprentice: 2.73 Pounds X $1.36 = $3.71

In either measure, the minimum wage for those over 21 in the UK is higher than the US minimum wage.

However, below that level using PPP the effective minimum wage falls below that of the US. US teens are "better off" in terms of the wage (I am NOT factoring in other benefits or costs  that exist--just comparing the absolute wage rate).

When reading media accounts of the differences in Minimum Wages around the world it is important to know if they are reporting in actual exchange rates or in PPP.

As you can see, it makes a BIG difference.

NOTE: Here is a link to an entry I did like this for AUSTRALIA.

Thursday, October 9, 2014

China vs the US in GDP measurement. I try to explain it using actual vs PPP exchange rates.

China reported its Gross Domestic Product to be 56.88 trillion Yuan in 2013. I am going to assume this is "Nominal GDP", not adjusted for inflation, but I do not know that for certain.  I got this from a Chinese newspaper Zinhuanet HERE.  On January 1st of 2014 the official exchange rate was 1 Renminbi (Yuan and Renminbi are used interchangeably, sort of) exchanged for $.16529 US cents.

So, putting the GDP in Yuan in dollar terms at the market exchange rate we would take 56.88 Trillion Yuan multiplied by $.16529 and that would equal $9.4 Trillion US dollars.

At the end of 2013 the US Real GDP was $16.768 Trillion dollars (Nominal dollars)

Either way you figure it US GDP is about $7 Trillion more than China's using current (Jan 1, 2014) market exchange rates.

What about many/most economists preferred measure of exchange rates: the Purchasing Power Parity (PPP)?

According to theWorld Bank, the PPP exchange rate (2011 is the latest calculation) is 1 Renminbi exchanges for $.28 US cents.

If we take 56.88 Trillion Yuan and multiply by $.28 US cents, the PPPexchange rate, we get $15.926 Trillion US dollars, about $800 million shy of the US GDP at the end of 2013.

The big picture here suggests the Yuan is UNDERVALUED relative to the US dollar.  Instead of the actual market exchange rate where $1.00 US dollar "buys" 6.04 Yuan (or 1 Yuan buys $.16529 US cents) it should buy only 3.57 Yuan ( or 1 Yuan buys $.28 US Cents) based on PPP.

In other words, the dollar should be weaker (depreciate) and the Yuan should be stronger (Appreciate).

But it is not, hence the difference in nominal GDP's based on actual exchange rates as compared to PPP.

I hope that makes some sense. Quite the difficult concept to walk through!


Depreciation and Small businesses in Japan. My example.

Here is a nice article on how swings in currency exchange rates are having an adverse affect on small businesses in Japan. Here is an excerpt and below that I do a simple example to show how this works in "real life".  Exchange Rates MATTER!

Data Show More Smaller Companies Succumbing to Weak Yen

"The failed businesses, many of them small, were struck by the higher costs of imported materials such as fuel, minerals and food as the exchange rate shifted from less than ¥80 per dollar two years ago to as high as ¥110 in recent days.(*emphasis mine).
Hit hardest was the transportation industry, including trucking companies, which saw 81 companies go bankrupt. The number of insolvencies totaled 44 in manufacturing, 41 in wholesale and 19 in services, the research company said."
Example:

I am a Japanese small business-person.  I produce a "widget" that sells for $100 Yen in Tokyo.

Assume half the cost of producing and selling one widget comes from inputs I must import from the US--50 Yen. Prior to the weakening of the Yen against the dollar, one US dollar exchanged for 80 Yen or, inversely, one Yen exchanged for 1.3 US cents.

So, for me to purchase my inputs from the US I took 50 Yen and sold them for 1.3 cents each for a total of 6.5 US cents. Remember, this is half the cost for me to produce and sell the widget. This means the price for my widget, in US currency, is 13 US cents.

Now, the exchange rate moves to one US dollar exchanges for 110 Yen or, inversely, one Yen exchanges for .9 US cents (9/10ths of a cent/penny).  The Yen does not "buy" as much US currency as it did before.  So I am going to have to give up MORE Yen in order to pay for the 6.5 US cents worth of inputs I need.

How many Yen do I need at the exchange rate of one Yen buys 9/10th of a cent to get 6.5 US cents?

YEN ("X") Times .09 US cents = 6.5 US Cents.  Solve for YEN "X" and you get 72.22 Yen.

Through no fault of my own, events beyond my control, my cost of production using US inputs has increased from 50 Yen to 72.22 Yen, a 44% increase.

Assuming I have little pricing power domestically because of competition and cannot raise the price, it is easy to see how small companies in Japan are under pressure. If they cannot cut costs elsewhere to off-set the currency swing, then they risk going out of business.

I hope this simple example helps you understand better how changes in exchanges rates can affect big AND small businesses.


Tuesday, October 7, 2014

Lower gas prices and higher consumer welfare for the win.

I read the following passage at Carpe Diem (emphasis mine):
According to the Department of Energy, Americans buy 365 million gallons of gasoline every day, so every one cent drop in prices at the pump saves consumers $3.65 million per day, and $1.33 billion dollars over a year. Therefore, the 42 cent drop in prices since April will save US consumers almost $56 billion over the next year compared to what they would have paid if gas remained at $3.70 per gallon.
Think of an increase or decrease in the price of a good (or service) as a transfer of purchasing power from producer to consumer and vice versa.

When the price of something that is effectively a fixed "need" in the short term (gasoline, some food items, a utility bill, etc) changes is has a large impact on our individual welfare and consumption possibilities for other goods/servics that are more "luxuries" (by way of a very lenient definition) to us.

Those saved dollars from lower gas prices might not be explicit to us but they do appear elsewhere in the bundle of goods/services we consume on a regular basis.

I would think a good portion of that $56 billion shows up in retail spending such as food away from home, entertainment, and whatever you might buy at the Mall/Walmart after you fill up the tank.

In terms of GDP it is a wash.  Either the fuel companies get the money or you do and in turn other businesses get it when you spend it.

However, in terms of our standard of living, individually we are better off because we get to purchase other stuff with the extra money from lower gasoline prices.

This "surplus" welfare for consumers is not captured in the GDP accounting.

However, it is captured in my heart.  I LOVE MY SURPLUS!

NFL prices in 1989 and today. Nice lesson on Inflation.

I found this on Twitter (I do not have the original link).

Shows how much a Season Ticket Package for all the NFL teams cost in 1989 (or it could be 1990, it does not show) in the far right column.

I am assuming the numbers for each year are the number of season ticket packages that were sold then the percent change from 1988 to 1989.

Divide each package by 8 games and you will get the single game price.


Below is a price list for 2013. The yellow highlighted section is for average individual, single game tickets.

Compare the single game price average in 1989 (divide the season package price by 8) with the prices below.

General inflation has increase 92% since 1989 (put $1.00 in the BLS calculator for 1989)

The 1988 (season) Super Bowl Champion was the SF 49ers.

A single game ticket now costs about $84 on average ($275 for a premium ticket).  In 1989 you could get an 8 game season ticket for $250.00, for an average game price of $31.25.  Depending on how much of a break one gets today on the season ticket cost for that seat it may very well work out that a ticket to a 49ers game has kept up with inflation (more likely it has fell behind, though).  We would have to compare a comparable seat.

Have fun with your favorite team and see how much prices have increased relative to inflation.

Source: HERE

Sunday, October 5, 2014

Sometimes Appreciation is not appreciated at all: The currency edtion

Companies that do business internationally care about movements in currency exchange rates.  They can affect the bottom line in a way the corporation has little control.

Latest Threat to Corporate Earnings: The Almighty Dollar
"While U.S. executives must be pleased with encouraging news about the economy—including Friday’s strong jobs report—it may prove a mixed blessing for their bottom lines. That is because American corporations, as represented by the S&P 500, aren’t that American. Over 40% of sales come from outside the country. 
The problem isn’t only the absence of similar momentum abroad, but that the U.S. increasingly looks like it will soon be on the road to higher interest rates. 
That makes the dollar relatively attractive. In just the past three months, the greenback has gained 8.4% against the euro and 7.5% against the yen, big moves in the foreign-exchange market." (Emphasis mine)
 A simple example to illustrate this.

Assume the US dollar and the Euro are trading at parity:  $1.00 exchanges for 1.00 Euro, 1.00 Euro exchanges for $1.00 (they are not, but go with it).

So, profits of 1,000,000 Euros will exchange back into $1,000,000US dollars.

The Dollar "gains" or appreciates 8.4% as the excerpt above suggests.  This means that $1.00US will exchange for 1.084 Euros and 1.00 Euro will exchange for $.923 US cents ($1.00/1.084 Euros--a simple reciprocal).

So, our 1,000,000 in profits in Euros will exchange into $923,000US dollars (1M Euros X $.923)---a loss through the exchange rate change of $77,000 US dollars.

However, there is a flip side for a European firm making profits in the US.

If they take profits of $1,000,000 US dollars and exchange it back into Euros they will receive 1,084,000 Euros---a gain of 84,000 Euros as a result of the currency change.

Exchange rate swings can be a blessing or a curse for a corporation expatriating profits. It just depends on which side of the fence you are standing on as to how you will be affected.

The War on Salmon! Smoke dope, eat almonds, kill fish.

Two articles I read this morning have the same thing in common---the plight of salmon in California due to a severe water shortage.  Nice examples of scarcity of a resource (water) and how opportunity costs arise in allocating that resource (for salmon? almonds? marijuana?).

Each article cites a different culprit for the suffering salmon (emphasis mine):

Cannabis farming in California using so much water it could wipe out salmon population, biologists warn

"Water use and other actions by the marijuana industry in the Emerald Triangle of Northern California and Southern Oregon are threatening salmon already in danger of extinction, US biologists have said."
California Drought Has Wild Salmon Competing With Almonds For Water
"The ongoing California drought has pitted wild salmon against farmers in a fight for water. While growers of almonds, one of the state's biggest and most lucrative crops, enjoy booming production and skyrocketing sales to China, the fish, it seems, might be left high and dry this summer—and maybe even dead."
Use marijuana, quench the munchies with almonds, kill salmon.

Save the salmon, but don't smoke dope and/or eat almonds.

Change the order, but the lesson remains the same:  Choices, choices...

Friday, October 3, 2014

How are Complementary Goods like Unicorns?

Sometimes is it hard to come up with good examples of Complements when studying the basics of supply and demand.  They can be elusive, like unicorns.

Complementary Goods are generally taught as a demand-side function.  It describes the relationship between two goods that are separate and distinct but often (or always) used together. There is an INVERSE relationship between the change the price of one good and the demand for the other.

Here is an example (source HERE)

Low meat supply, low spice demand

You may remember hearing about a shortage of certain meat products at fast-food restaurants in China over the summer, due to the news that a major supplier was handling meat improperly and selling expired meat to restaurants. 
The impact reached across oceans, certainly to the fast-food chains like McDonald’s, which changed suppliers and couldn’t keep up with the demand because of the news. 
But less meat to eat also means less meat to season, so McCormick & Co. Inc. also lost out. The Baltimore-based spice maker acknowledged the effects in its quarterly report Thursday. 
“Our quick service restaurant customers in the Asia-Pacific region are currently being impacted by well-publicized supply issues,” said President and CEO Alan Wilson. “This is affecting our sales results in the region and has us cautious in our near term outlook.” 
That region showed a 1 percent decrease in industrial sales as a result.
With a decrease in supply of beef the price of beef increases.  When the price deceases the quantity demanded for beef decreases (movement ALONG the Demand Curve).

With less beef being produced and consumed there is less need for complementary goods, like spices. The Demand for spices will decrease as a result.

Notice the inverse relationship:  Price of Beef Increases, the Demand for Spices  Decreases.  

That is characteristic of Complementary goods (and services).

Having fun with 1938 prices.

Nice graphic showing a cross-section of prices in 1938 (Link HERE).  How have things changed?

Embedded image permalink
Source: Classic Pics on Twitter
Here are the same prices with the inflation adjusted figure in parenthesis.  In other words, if these individual 1938 prices kept pace with overall inflation then the amount in parenthesis would be what those items would cost in today's dollars.

          New House:  $3,900.00 ($65,788.85)

          Average Income: $1,731.00/year ($29,200.13)

          New Car: $860 ($14,507.29)

          Average Rent: $27.00/month ($455.46)

          Tuition to Harvard University: $420.00/year ($7,084.95)

          Movie Ticket: $.25 ($4.22)

          Gasoline: $.10/gallon ($1.69)

          US Postage Stamp: $.10 ($1.69)

          Granulated Sugar: $.59 for 10 pounds ($9.95)

          Vitamin D Milk: $.50/gallon ($8.43)

          Ground Coffee: $.39/pound ($6.58)

          Bacon: $.32/pound ($5.40)

          Eggs: $.18/dozen ($3.04)

One way to look at this:  If the number in parenthesis is GREATER than what you would pay for that good today, then over time the price of that good has risen LESS than inflation.  You can look at this as a good thing.

Couple of observations:

A stamp to mail a letter today is $.49.  If it had increased with general rate of inflation since 1938 it would be $1.69 today.

I am pretty sure just ONE class at Harvard costs $7,000 today so the cost of Harvard has increase MUCH more than the general rate of inflation.

A movie ticket (general admission, not discounted) is more than $4.22 today.

You might say the price of a new car has stayed the same.  You could buy a car today for $14,507 that one could argue is BETTER than a car built in 1938 in terms of features.

Probably gets beat on style, though! :)

It is interesting to me to look at history through the prism of prices. What do you see?

Friday, September 26, 2014

See the amount of Federal Tax Refunds issued for the day and tell me this is not inefficient

Below is a small section of the US Treasury's daily report on various metrics.  It is a short document and has some pretty interesting numbers as they pertain to the operations of the Federal Government.  I urge you to check it out.

I was lead to it from this Wall Street Journal blog entry.

This section made me pause.  It shows on a daily, monthly and yearly basis the amount of refunds the Federal Govt sends back to businesses and individuals. Presumably this is because after filing tax forms these entities proved to the government they over-paid throughout the year in tax withholding.

You can see the numbers below.

Tax refunds issued for the day were $397 million; for the month-to-date is $5.474 billion; and for the year-to-date is $361.193 billion.

It is nice to get these checks, but wouldn't it be more efficient to not go in such a roundabout way to keep the money flowing in the first place?  Seems like a significant amount of Dead Weight Loss is created--all it is doing is moving money in a circle and creating significant transaction costs, i.e. time, tax preparation, bureaucracy to handle it, etc, ad nauseam.

A Consumption tax? A Flat Tax?  A Something Else Tax?  Just explicitly pay what you owe, no more and no less.

Maybe I am just having a bad day... :)

From US Teasury Daily Report.

Thursday, September 25, 2014

Price of iPhones, in select countries, converted into US dollars. Is arbitrage the reason for long lines?

I found the prices of the new iPhone6 in various countries at this link HERE.  They have the prices for the "regular" one and the "Plus".

The conversion I do below is just for the "regular" iPhone With NO CONTRACT.

In the first column are the prices in local currency for the respective country.

The second column I calculated how much the holders of those currencies would have to exchange in order to buy the iPhone in the US instead.

The third column shows the difference in local currency between what it would cost residents to buy an iPhone in their own country at the local price vs how much they would have to convert to buy it in the US in US dollars.

For example, in the UK a 16GB phone is  £539.  In the US it is $649.  At today's exchange rate of 1 pound sterling exchanges for $1.633384 dollars, a Brit would need exactly £397.22 to buy the phone in the US.  That is a SAVINGS of £141.78 for them over the UK retail price!

In US dollars that is $231.58 ( £141.78 X $1.633384). A lot, isn't it?  Seems like a GREAT opportunity for "Arbitrage".  Buy low at retail in the US and still sell below the retail price in the UK and make some money, right?


Included in the price quoted above for the UK (and I believe for the other countries listed) is a thing called the Value Added Tax or "VAT.

Here is the breakdown for the UK (found HERE)

16GB - £539 (£449.17 ex VAT)
64GB - £619 (£515.83 ex VAT)
128GB - £699 (£582.50 ex VAT)

So the ACTUAL prices of the phones, minus the VAT, are in parenthesis.  If you take these numbers and subtract  the 2nd column numbers it will show a much lower difference, hence a smaller arbitrage opportunity. It almost disappears if you were to add on the Sales Tax to the US prices listed.

It seems to only way to make money buying in the US and selling in the UK (and the other countries listed EXCEPT Japan) is to trade on the Black Market to avoid the steep VAT taxes.

I am sure that is not the reason for the long lines in the US and people buying multiple phones....RIGHT?

Corn prices down. My graphs showing how this affects the farmer (AP Micro)

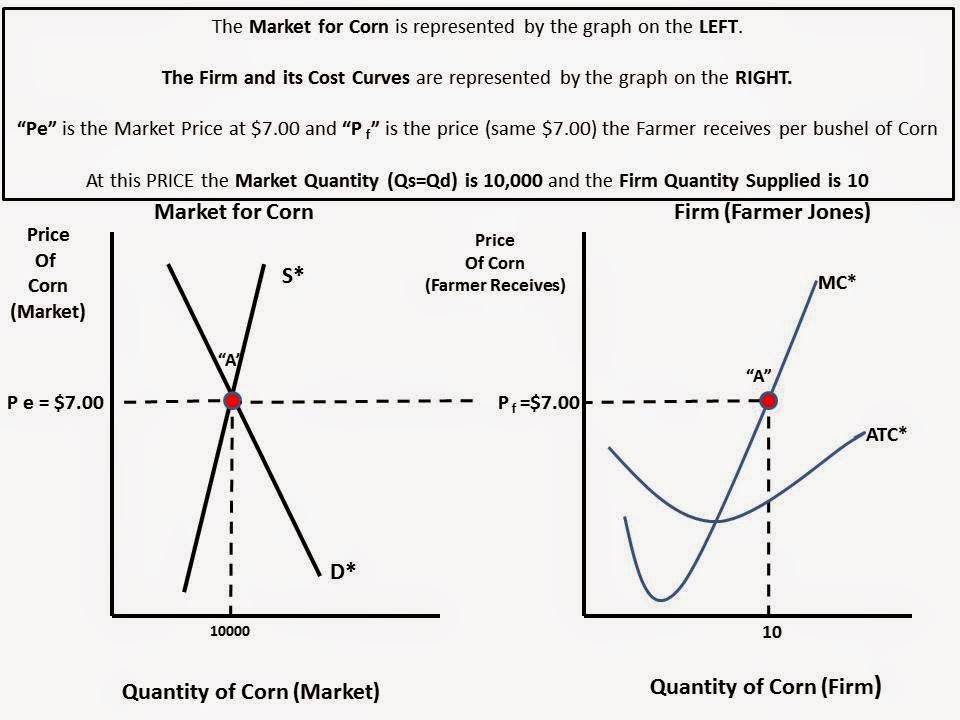
A current event gives me an opportunity to create a series of graphs to illustrate what happens to "Economic Profits"in a market that is considered "Perfectly Competitive" when there is a price decrease AND the cost structure remains relatively constant.
Ohio corn farmers might be producing more crops, but the boom in supply and higher expenses are driving down profits this year. 
Most farmers are reporting they are producing more bushels this year, but the price they're able to get for the commodity has been roughly cut in half compared to last year. 
Western Ohio farmer Tom Tullis said he regularly saw corn prices as high as $6.50 or $7 per bushel as late as last year. But prices this year have been closer to $3. At the same time, operating costs such as machinery and fertilizer have remained high. (Note: I read that "constant")
"It's about half price or below what it was last year," Tullis told the Dayton Daily News (http://bit.ly/1uwu8jN ). "And our inputs are staying pretty much in the same place as far as fertilizer, chemicals and everything else. It's going to be a tough one." 
Most farmers will have enough assets to withstand a tough year or two, said Matt Roberts, an agricultural economist for Ohio State University Extension. The majority of farmers across the state will likely break even this year, Roberts said, although there will be some who lose money."
In the graphs below, I use $7.00 as last years price and $3.50 as this years price.  I use $3.50 as the Average Total Cost (ATC) of producing because it is suggested in the article that farmers are either making a small profit at that level or might even be losing money at that cost. In other words, it is the rough "break-even" point.


Wednesday, September 17, 2014

How much is "50 Cent" the rapper worth in Foreign Currencies? Economics is FUN!

On David Wessel's Twitter feed he retweeted this:


I thought it funny as well.

Using my meager Excel skills, I cobbled together the latest exchange rates from the Wall Street Journal (Sept 17th, 2014).

In order to give it a little more perspective, I determined what it would take in US currency for 50 Cent the rapper to be the equivalent of 50% (half) of the foreign currency.  Sometimes he needs to be a little more but for the most part he can be a less than himself.

Example: Look at the BLUE column for and the first entry for the Kuwaiti Dinar.


It shows that 50 Cent would actually have to be "174 Cent" ($1.74) in order to exchange for half a Kuwaiti Dinar.  I got $1.74 by dividing the "US Dollar per Foreign Currency" (3rd column--the actual exchange rate) by $.50 cents.  In other words "If it takes $3.49 to "buy" one Kuwaiti Dinar then it will take $1.74 (rounded) to buy half a Kuwaiti Dinar".

From the Kuwaiti Dinar on down the list, 50 Cent would have to be MORE than himself to be the equivalent in the particular foreign currency...until you get to Ecuador.  Ecuador uses the dollar so 50 Cent would be $.50 in Ecuador.

In any country below Ecuador, 50 Cent can be LESS than himself and still have some left over!

For example, in Canada he would only have to be 46 Cent (rounded) and enjoy a 4 Cent surplus. :)

NOTE: To find the calculation consistent with what is highlighted in the newspaper clipping, take the RECIPROCAL of the numbers you see in the RIGHT hand column below.

Basic Supply and Demand illustration. Hope it helps.

The corn crop for this year (2014) is scheduled to be the most productive ever, with per acre yields in the 162 bushel range (a bushel is 70 pounds for Corn).

For farmers this is a blessing and a curse at the same time. For the individual farmer a bumper crop is good--more corn to sell at the anticipated market price.  However, if ALL farmers experience a bumper crop then that will increase the supply of corn and lower the expect price of corn (per bushel).  It is a catch 22 situation:

Farmers worry good corn crop could mean low prices

"Agricultural officials are projecting an 11 percent increase in the size of Wisconsin's corn harvest this year, a prediction that has farmers worried prices will drop too low for them to make a profit.
State projections call for corn yields of 162 bushels per acre, an increase of 16 bushels per acre from last year....
Richard Halopka, an agriculture agent in Clark County, noted that if prices are too low, farmers don't have to sell right away.
"One unique thing in this county is that we do have a fair amount of storage locally, which could get stretched if we have a bumper crop," he said....
I put together some slides to illustrate this excerpt from the article.  

If you are teaching or learning the basics of Supply and Demand you may find it useful. 

Distinguishing the difference between a change is Supply vs a change in Quantity Supplied (the same for Demand) is one of the most diffcult things to intuitively understand in an economics principles class. I hope it helps.


Monday, September 15, 2014

Literally and figuratively the butter spread is getting wider. See how that affects trade flows.

The price of butter has surged in recent days as well as recent months. Here is a graph I created showing the price of butter in the US and in world markets.  The prices are per pound based on a  metric ton (2204.62 lbs) so this is the price at production for wholesale sale, NOT RETAIL (the price you see at the store).

The world prices since 2/19/2013 are in RED and the US price is in BLUE.

Notice, of the most part, world prices are consisently above the US price but a crossover occurs between March 19th and April 19 of 2014.  Then there is a significant diverence where the US price quickly outpaces the world price.

As of today (9/15/2015) the US price is at $3.00 lbs and the world price is about $1.25 (Source) so on the graph the RED world price line end point is the same but the US red line extends up to the $3.00 mark.  The spread is even wider than what appears on the graph!

Source: Haywardeconblog. Using historical data from HERE and HERE
This gives me an opportunity to do a lesson on international trade to show what happens in markets when the world price of a good is differnt from the domestic price and how trade flows might be affected.


View My Stats