Wednesday, July 18, 2012

Was Romney right in saying we need fewer Fire Fighters? See the graphs/data here before yelling at me...

Here are a couple of graphs showing some interesting information regarding firemen (and women).

The first one shows the decrease in the number of fires since 1980 (the RED line and look at the left hand scale) of about 40% and the increase in the number of firefighters (BLUE line and look at the right hand scale) of about 40%.  We have many more firemen fighting fewer fires.
Source: Marginal Revolution

The second graph is pretty self-explanatory.  The left scale shows the number of calls to the fire department  for medical calls (BLUE line), actual fire calls (Solid RED line) and false alarms (dotted RED line). 
Source: Marginal Revolution

In most cities we have firehouses that support BOTH ambulance service and firefighting equipment/trucks.  The trend in the graphs seem to show we need fewer, expensive full service firehouses and more ambulance based houses with less capital requirements (trucks, etc) that would be less expensive. 

Having said this, I LOVE MY FIRE DEPARTMENT!! :)

Batman vs Spiderman--nice income inequality info-graphic.

Equal opportunity does not guarantee equal outcomes. :)
Click image to see a larger version
Superhero Economics
Superhero Economics: Bruce Wayne vs. Peter Parker via H&R Block

Friday, July 6, 2012

UN calls for a billionaires tax to help the world's poor. Thought I would re-write the headline so it actually solves the problem...

Saw this headline on Yahoo!News: 
UN calls for 'billionaires tax' to help world's poor.
I thought this is what the headline should really be to actually produce some positive results:
"UN calls for 'billionaires tax'  government  reforms in under-developed countries to help world's poor become billionaires (or millionaires, thousand-aires, or whatever they would like to be)"
Just sayin'...

Quick Snapshot of todays Employment Report---Not good...

The significant gainers for the month are in BLACK and the losers are in RED. Numbers are in thousands, so add 3 zeroes behind the number.  Be careful to not include the headline category number when you look at these.  Look at the sub headings for the job number.

Temporary help, Leisure and Hospitality, and Healthcare jobs are NOT going to lead a robust recovery. 

Thursday, July 5, 2012

"You should drive a car "Made in America"! Well, I do in fact drive the car with the MOST US sourced parts and labor--- Toyota Camry. See more here...

Cars.com comes out with this list every year.  It is a ranking of cars made in the USA, regardless of ownership of the automaker, based on the source of parts and final assembly.  Turns out that some of the most popular cars produced by the Japanese are more "Made in America" than some of the US manufacturers of cars. 

5 of 10 models of cars with high (more than 75%)  US sourced parts and labor are either Toyota or Honda models...(HT: Carpe Diem---as always)

A little data on the number of doctors we have in the US---Domestic and Foreign. Do we have too many doctors with not enough to do or do we have a shortage? Maybe both...

Data is from the Census HERE

From 1980 to 2009, the average yearly NET change in the US (new entrants plus current MD's minus leavers) in MD's with US medical school degrees is 12,068---These are additional, domestically "produced" doctors EACH YEAR.

The average net change in MD's from foreign medical school degrees is 5,310. There are additional, foreign "produced" doctors EACH YEAR.

Average total change in the number of doctors in the US, per year over 29 years, is 17,378  medical doctors--domestic plus "foreign".

The graph below shows, in RED, the number of US Medical School graduates over time, and the projected number of doctors, in BLUE, that we would need to maintain the same doctor-per-person ratio.
Source: Carpe Diem

Notice the number of Medical School graduates (RED) stays relatively constant since the 1980-1985 period.
Keep in mind, not all of these graduates will eventually become doctors.  If fact, it looks like in any given years roughly 4,000 per year do not become full-fledged doctors, hence the need to "import" doctors from abroad (or at least from "Non-US Medical Schools").

The graph shows, based on population trends, we are not keeping a consistent doctor-per-person ratio. It suggests we are about 1,200 doctors short.

With the increase in demand for healthcare anticipated from the Affordable Healthcare Act, we will have to either increase the number of students graduating from US medical schools and/or increase the importation of doctors.

My question is: why has it not been policy to do either, given the population trend?  Do we have excess capacity in MD'S---too many with not enough to do? Or is it an artificial shortage encouraged by government policy/lobbying by interested parties?

I dunno....

Tuesday, July 3, 2012

My contribution to the 4th of July mixed with a political message..Cannot resist.

""The Founding Fathers left their generation with a signed document that empowered people to resist the Tyranny of a King, and they did so at a large cost to themselves.  Today, we ask politicians to sign a document to resist the Tyranny of King Dollar (Campaign Contributions) and they do NOT do so because the cost is too large to themselves---See the difference?""---Me while running errands.

Sunday, July 1, 2012

"Keynes vs Hayek" mini-rap video. If you are a fan you will want to see this one. Oh, and buy a t-shirt too.

If you follow the "Keynes vs Hayek" economics rap videos, this "mini-episode" will amuse you.  Wish they could turn this into a TV series, a la "The Big Bang Theory".  :)

Here is my quick analysis of how a small business makes a hiring decision in terms of Stimulus vs real economic growth. Need your help in telling me where I am going wrong...

If I were a small businessman looking at the economic landscape and how it is being addressed by our political class (and reported on by the media), I would wonder if they had any idea of what my day is like and how I make hiring decisions.  Keep in mind, I am just a "regular Joe/Josephine" trying to do the best I can.

Senario 1: Assume I hear of a local business getting stimulus funds to do some road work in my area and I know there will be 100 additional workers with, say, $20 additional discretionary dollars to spend at my business during any given day (not all at once, spread out during the day).  Remember, I am not the only business in town, so my fellow shopkeepers are in the same position I am in. 

I know this will money is temporary and will last about 6 months and we will go back to status quo.

With this information, do I ask my existing workers to (1) work harder, (2) give my part-timers more hours, (3) offer overtime to existing full-time employees or (4) hire an additional full-time and/or part-time worker? 

Given what I know, I am pretty sure 1-3 are viable options, with preference to (1) and (2), but I am pretty sure I don't do  #4. 

Scenario 2:  A new company (or an existing one expanding operations)  renovates and moves into a building down the street from me.  I know there will be an addtional 100 workers with, say, $20 additional discretionary dollars to spend at my business during any given day on a permanent basis.

I know this money will not be temporary, will last well into the forseeable future and we will NOT go back to the status quo.  In other words there is a sustained higher level of spending in my business.

Using numbers 1-4 above, how might my hiring decision(s) be affected now? Does it change, "at the margin"?  When I look at my current situation, I believe I have to go with (2) at the minimum and/or most likely (4) , right?

Conclusion:  As a small businessman, I am happy with Scenario #1 because it allowed me to potentially "save" a job in my business that I otherwise might have had to eliminate---it did create stability for me.  Although some of my fellow shopkeepers may have been able to "create" a new, sustained job from the temporary stimulus, I think a majority of them faced the same dilemma I did in making hiring decisions.

What small business people are looking for are signs of Senario #2 emerging beyond what has been offered in Scenario #1.  Only when that "Leap" is made from one to the other, will  they hire and we will have a robust expansion and recovery.

The question is, how do we move from one scenario to the other?  Are policy makers and politicians focused enough on that or are we still just short term thinkers?

Saturday, June 30, 2012

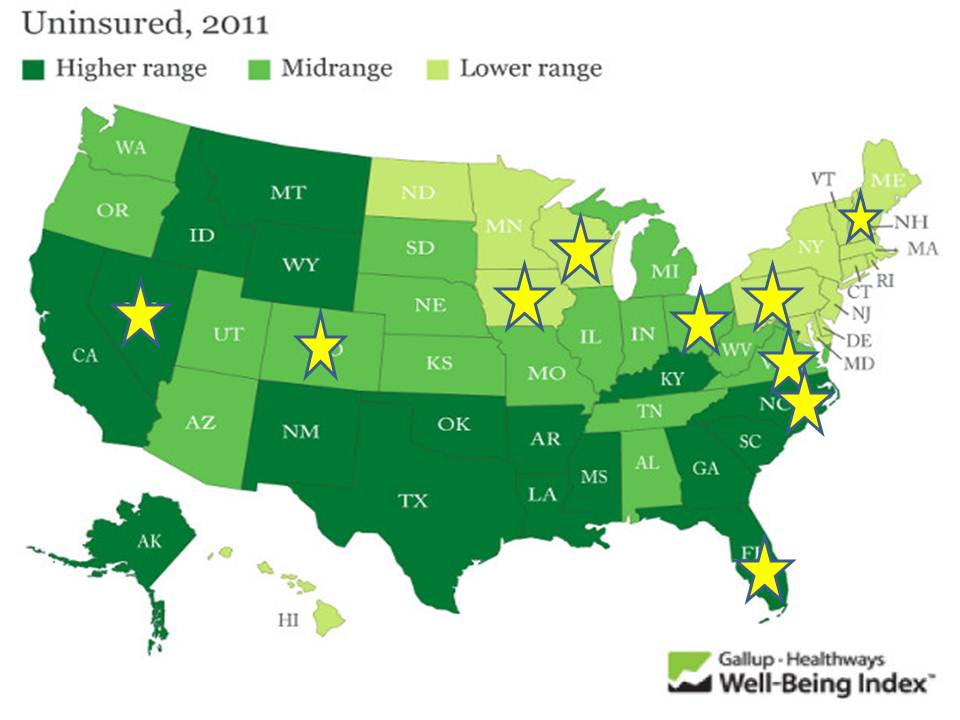
"Obamacare" is now the law. See this map I put together that shows who will win the Presidency in November...

This map shows all the States and general level of the population without health insurance. I put a yellow star on the States that are considered Electoral College Toss Up States.

Look at the States that are Dark Green AND have a star on it---High Uninsured and a Toss-Up electorally---Alaska, Nevada, North Carolina and Florida.  Florida is the Big One with 29 Electoral College votes up for grabs---Advantage and Re-Election(?) for Pres Obama.  We elect Presidents through the Electoral College, not popular vote.  This matters!

Latest CBO (non-partisan govt office) revenue and cost estimate for the ACA ("ObamaCare"). "We are going to need a bigger Revenue Boat"...

This is the latest (March 2012) revenue and cost estimate for the now legal American HealthCare Act (ACA--aka--"ObamaCare").  CAUTION: notice the cost numbers are positive and the revenue numbers are negative here.  The bottom line number is "$1,252 Trillion" accumlated DEFICIT over the 11 year projection.  This is in ADDITION to any existing budge deficits occurring during this time span.

In other words, on average ($1,252T divided by 11), the Federal budget is going to require an additional $114 billion each year to pay for the ACA.  Again, this is over and above what the budget collects and spends currently on everything else.  This is a fact---I did not make up these numbers and they did not come a biased think tank. (Click on image to make larger)

Source: CBO Analysis March 2012
My educated guess is that this underestimates the costs and overestimates the revenues.  So the deficit in the program will likely be larger.  How much (?), no idea. Other than this has been the case for just about EVERY other sweeping program implemented in the last 20 years.  Am I wrong?

Given these numbers, where is the additonal revenue going to come from? Just askin'...

Thursday, June 28, 2012

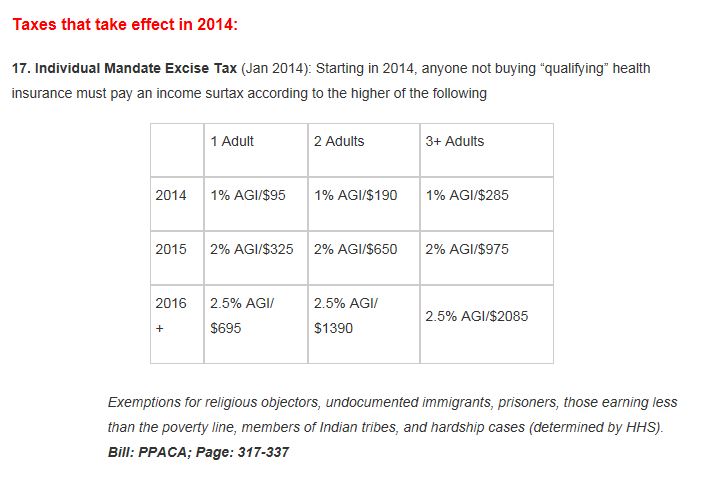
IF the Individual Mandate is upheld, here is a chart showing the Tax (or "fee") you will pay for not being insured...

If by some unexpected circumstance the Individual Mandate is declared Constitutional by the Supreme Court today, the chart below shows how the tax (or "Fee", I think it is actually called in the ACA bill) will play out for you.

Source: HERE
Example: If "1 Adult" in 2014 decided not to buy their own health insurance they would have to pay 1% of their Adjusted Gross Income (AGI--- your income that is taxed AFTER you take deductions from your actual ("Gross") income you earned in 2014).

Let's say for 2014 you calculate your AGI to be $15,000 (your gross income would actually be, perhaps, $17,000). One percent of $15,000 would be $150. That is higher than $95 (the minimum) so $150 would be your tax for forgoing the purchase of health insurance.  This is in ADDITION to any other Federal Income tax you may owe.

Notice in 2016 that percentage increases to 2.5%. Assume your income stays the same, then your tax would be 2.5% X $15,000 = $375. However, the minimum in 2016 is $695 so that is what you would pay instead of the $375.

It the purchase of insurance cost you more than the tax (or "Fee) then you are better off just paying the tax. It will be cheaper for you.

Wednesday, June 27, 2012

Dispatch from the Political Middle.

"We probably should pay more in Federal Taxes, but I think we already overpay for what we get in Federal Government". ---words of a fictional "Politically Middle Voter"(really, me)

A bit of a pardox.

I think for a lot (most?) of people in the political middle, or people who just don't have the time or bandwidth to pay close attention, this is a fairly accurate "macro" view of the discussion on whether to raise Federal taxes or not.

However, if you apply this sentiment to individual programs, on a "micro" level,  I think you get a different outcome.  For example insert key words above with ANY Federal progam and see how you feel about it.  Examples:

"We probably should pay more in Federal Taxes for National Defense, but I think we already overpay for what we get in National Security". 
"We probably should pay more in Federal Taxes for Social Security and Medicare, but I think we already overpay for what we get in Social Security and Medicare benefits"
"We probably should pay more in Federal Taxes for Income Support programs for low income people, but I think we already overpay for what we get in return for helping low income people."
"We probably should pay more in Federal Taxes to fund public employee pensions, but I think we already overpay for what we give in retirement benefits for public employees."
"We probably should pay more in Federal Taxes to fund vital infrastructure projects, but I think we already overpay for the infrastructure we currently have".
If you are an ideologue and have definitive opinions on these issues, then these are easy for you. But if you are in the "Middle" it is not necessarily so clear.

As I think of more and more individual Federal programs, I find it more difficult to square the two clauses of the phrase I constructed.  How about you? Help me out.

You can do this at the State and Local level as well---insert police, firemen, and teachers (Oh, My!!).

Refer back to the original sentence that started this posting.  I blame current and past (40 years)Legislative and Executive branches for our jaded view expressed in the second clause in the sentence.  I resent this because it forces me to ponder the first clause. 

Sunday, June 24, 2012

Terrific interactive of "What Kills Us" since 1900. Whether you are taking a class or interested in the topic of healthcare, you will find this helpful...

A great set of  charts and graphs related to "what kills us" over time.  Worth a look if you are interested in, or taking a class in  healthcare, demographics, sociology, history, etc.  Go HERE (New England Journal of Medicine) for a terrific interactive and look at this information from many different angles. 

Source: Business Insider

Friday, June 22, 2012

The Obama Gift Registry to raise funds---Does this mean "Julia" is getting married?

I thought this was from the minds of the people at The Onion, but it is real.  I found it funny and wonder when the "Gravy Bowl" lobbyists will be out in force. 

Gravy Bowls are a consumption expenditure and is that not what we are tying to jumpstart?

So, the campaign is asking people to forego current consumption ("Gravy Bowl Stimulus") so they can (1) take a tax deductable donation (a dreaded "Tax Expenditure") that only higher income people normally take, and (2) make a speculative investment that has a 50-50 chance (according to polls) of success at this time.

Does anyone else see the irony here?  (Not being political, just cynical)...
Source: BarackObama.com
Here is the link to the video of "Julia" I mentioned in the title. It is a presentation of how a fictitious person grew up with the help of government benefits/programs....

View My Stats