The prices are established in commodity exchanges, like the Chicago Mercantile Exchange (CME), based on world-wide demand and
supply. Farmers simply have to accept
what is offered. In economics, these producers are termed “Price-Takers”.
Agricultural markets are relatively stable over time, but because of many endogenous and exogenous variables that can and do affect farming, prices fluctuate. Sometimes the price is
higher than normal, sometimes lower.
In order to smooth out this pricing
volatility nations often employ various polices to make the price a farmer
receives for their crop more predictable over time. The Unitied States does this within the context of the US Farm Bill.
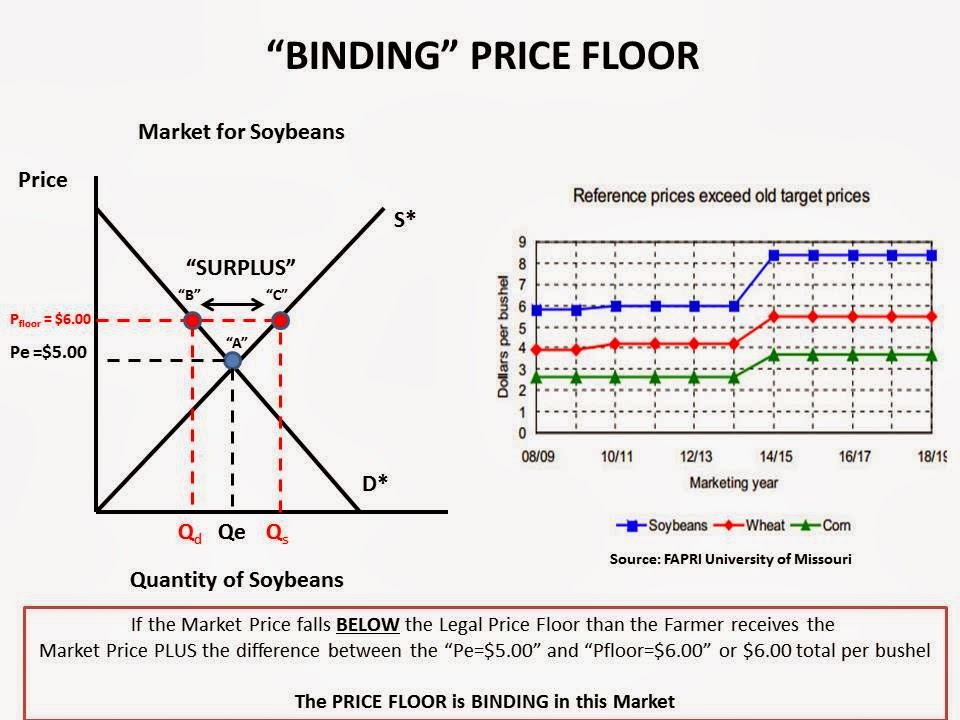
One such policy the government uses to aid farmers is called a “PRICE FLOOR”
Price Floors legally establish a MINIMUM PRICE
that the Farmer will receive per bushel of crop harvested.
If the market price falls below the Price Floor, the government makes up the difference so the farmer receives the pre-determined Price Floor price. This is what is termed a "BINDING PRICE FLOOR".
If the market price rises ABOVE the legal Price Floor then the farmer receives the market price and the Price Floor becomes irrelevant. This is termed a "NON-BINDING PRICE FLOOR".
Below is a series of graphs I made to illustrate both binding and non-binding price floors. For labeling purposes, I used Soybeans BUT it could apply to any of the commodities.
Within the slides I inserted a graph that shows the ACTUAL price floors past, present and future for Soybeans, Corn and Wheat as established in the recently passed US Farm Bill. I got this from HERE via Agricultural Reader.
This is a MUST know concept for the AP Microeconomics test! Hope it helps.


 View My Stats
No comments:
Post a Comment