Here are a couple of graphics from The Conversable Economist.
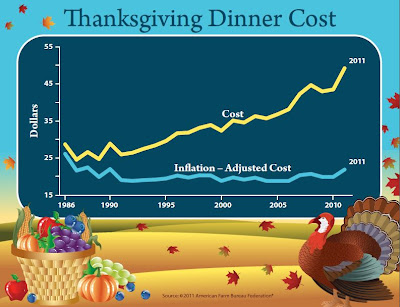
The first shows, in inflation adjusted dollars, the change in cost of a shopping basket (literally) of some typical food items needed to prepare a Thanksgiving meal. Not inclusive of everything, but a representation.
 |
| Source: The Farm Bureau Federation via The Conversable Economist |
But what about the average consumers ABILITY to purchase these goods in any given year?
One measure is to look at how many hours of work, given a persons wage, does it take to purchase this market basket of goodies.
In 1986 the nominal average hourly wage was $8.94 (average for the year--Data HERE--BEFORE TAXES). So in 1986 a worker had to work ($28.74 / $8.94) 3 hours and 15 minutes to pay for the market basket.(the prices for each years market basket are below)
In 2011 the nominal average hourly wage was $19.46 (before taxes). In 2011 a worker had to work ($49.20 / $19.46) 2 hours and 32 minutes to pay for the same market basket.
The average worker today worked 45 minutes less to earn the money for Thanksgiving dinner than he/she did in 1986.
Variables to consider: If taxes and/or other deductions are higher today than the nominal wage would certainly be lower, hence take more time to purchase the market basket. Are the quality of the goods in the basket better, worse, the same? What else am I missing? Start a list...
 |
| Source: Farm Bureau Federation |
No comments:
Post a Comment