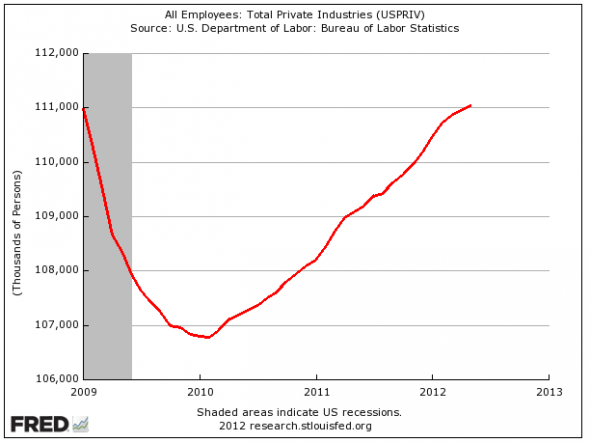
The gray area represents the period of official recession. I included a second graph that extends the time period back to 2001 so you can get some perspective.
Here is where the politics of this first graph comes in.
When the President states, as he did this week, that we have "created" 4.3 million jobs in the last 27 months he is starting at the lowest point of the graph, conveniently ignoring the time in office before the low point.
Candidate Romney looks at this graph and sees no new "net" job creation since the Pres. took office---the line ends where it started at about 111,000 jobs. We lost 4.3 million jobs then gained them back, conveniently ignoring the accelerating rate of job loss that started before Obama officially took office.
This begs the question: What does it mean to "create a job"? The answer is not as easy as it sounds.
Seems like BOTH are correct in their assertions. It is just how you look at the data and how it fits into your own political narrative. Don't you love economics---"On the one hand..."

 View My Stats
No comments:
Post a Comment