""...Since 1994, the consumer price of apparel, in real terms, has fallen by 39 percent..... In the mid-1990s, the average American bought 28 items of clothing a year. Today, we buy 59 items.
I was also intrigued by this:
"...We also throw away an average of 83 pounds of textiles per person, mostly discarded apparel, each year. That’s four times as much as we did in 1980, according to an EPA analysis of municipal waste streams [PDF]...."
This since they quoted the statistic on a per person basis, I wondered how much the population has changed since 1980. Here is the graph:
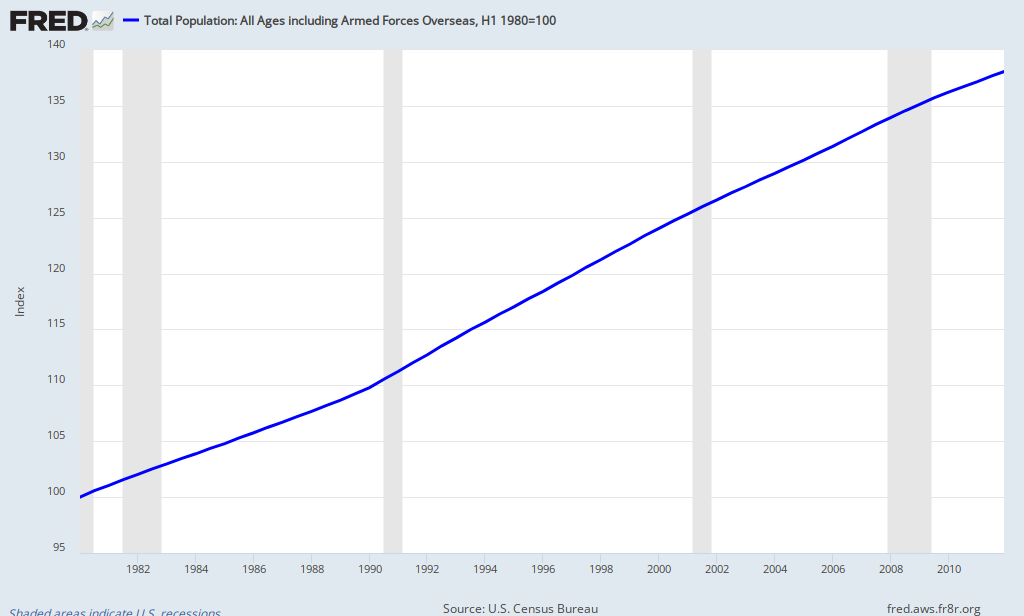
Using an Index of 100 to represent the base year 1980, we can see the population has increased approximately 38% since 1980. Population increased 38% and we throw away 400% more. I ain't no mathemetician, but that seems out of balance! Reduce, Reuse, (Recycle??)...MAYBE Will Johnson has a point!! :)
 View My Stats
No comments:
Post a Comment