Thank you for visiting my blog. I post things I think will be of interest to high school students and teachers of economics/government/civics etc. Please leave a comment if what you find here has been useful to you. THANK YOU!
Monday, May 7, 2012
I think the market supply curve is a mystery to most economics students. The demand curve is more intuitive because, well, we are all demanders of goods but few of us are suppliers/producers of a good.
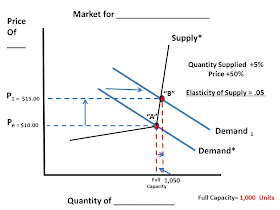
The supply curve on a graph reflects two things at the same time. The market price received by the producer (determined by Demand) AND the cost of producing a good. Specifically, regarding the last point, the marginal cost of producing one more unit of a good (movement ALONG the supply curve). Marginal cost is the additional cost in labor and materials needed to produce that extra unit.
In the market graph below I show the demand curve intersecting the supply curve at the "crook" of the supply curve. At point "A" the quantity demanded = quantity supplied at 1,000 units. I use point "A" as the current Full Capacity


No comments:
Post a Comment